
Digital Twin.
The digital twin is the foundation everything else stands on. It is a continuously calibrated, first-principles model of your full circuit — mass balance, mill filling, power draw, breakage, classification — that re-anchors itself to live measurements every cycle. The MPC trusts the twin's predictions because the twin tracks reality.
In process control terminology, the digital twin is the process model — the mathematical representation of how your circuit responds to changes in feed rate, water addition, ball charge, and ore hardness. A process model that drifts from reality produces bad predictions; one that re-anchors every cycle produces reliable ones.
See it running
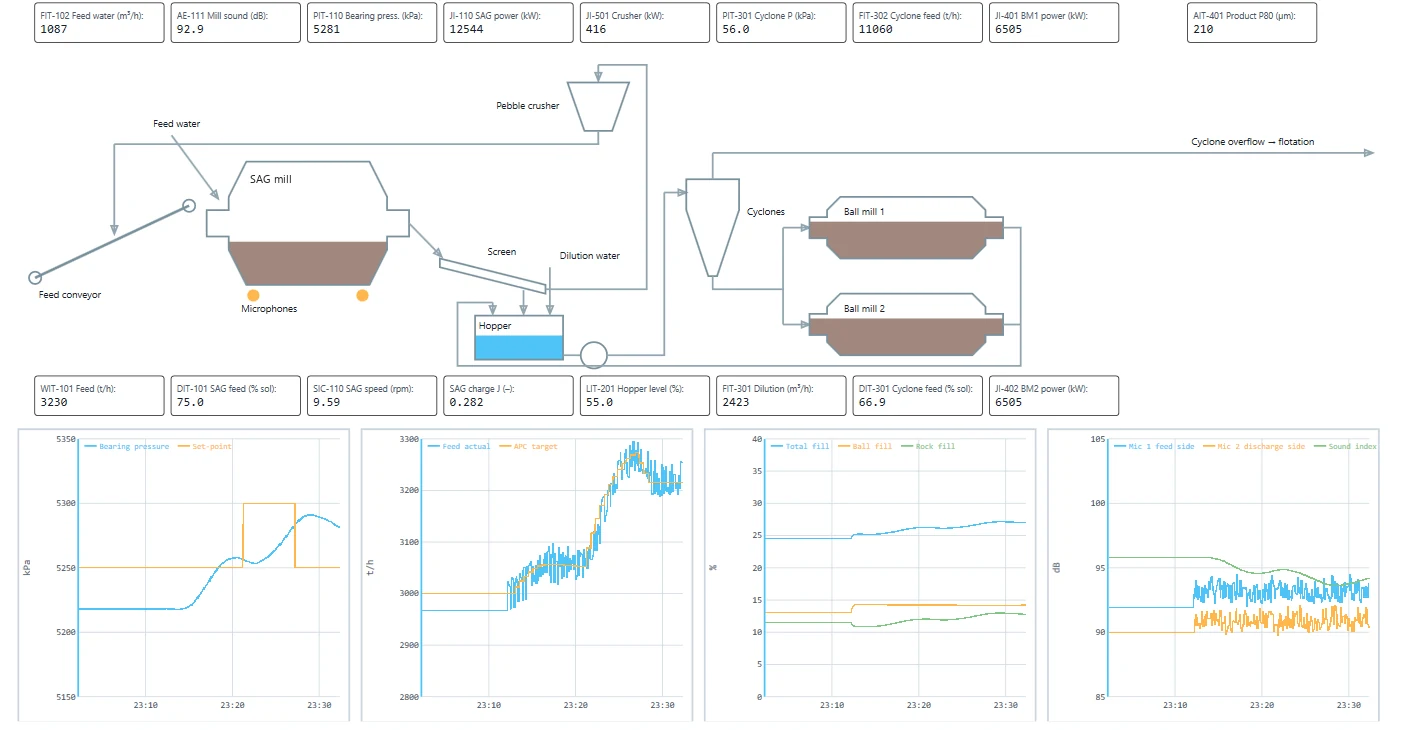
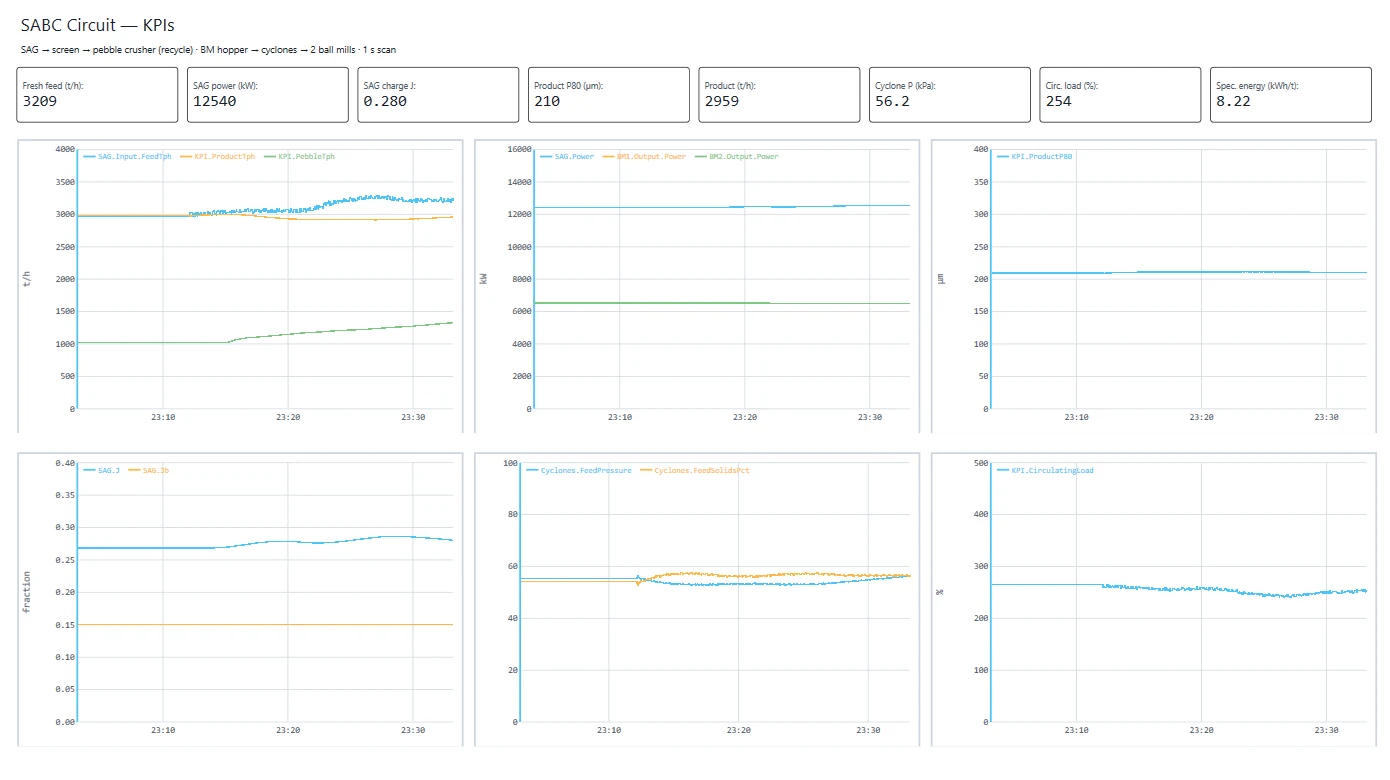
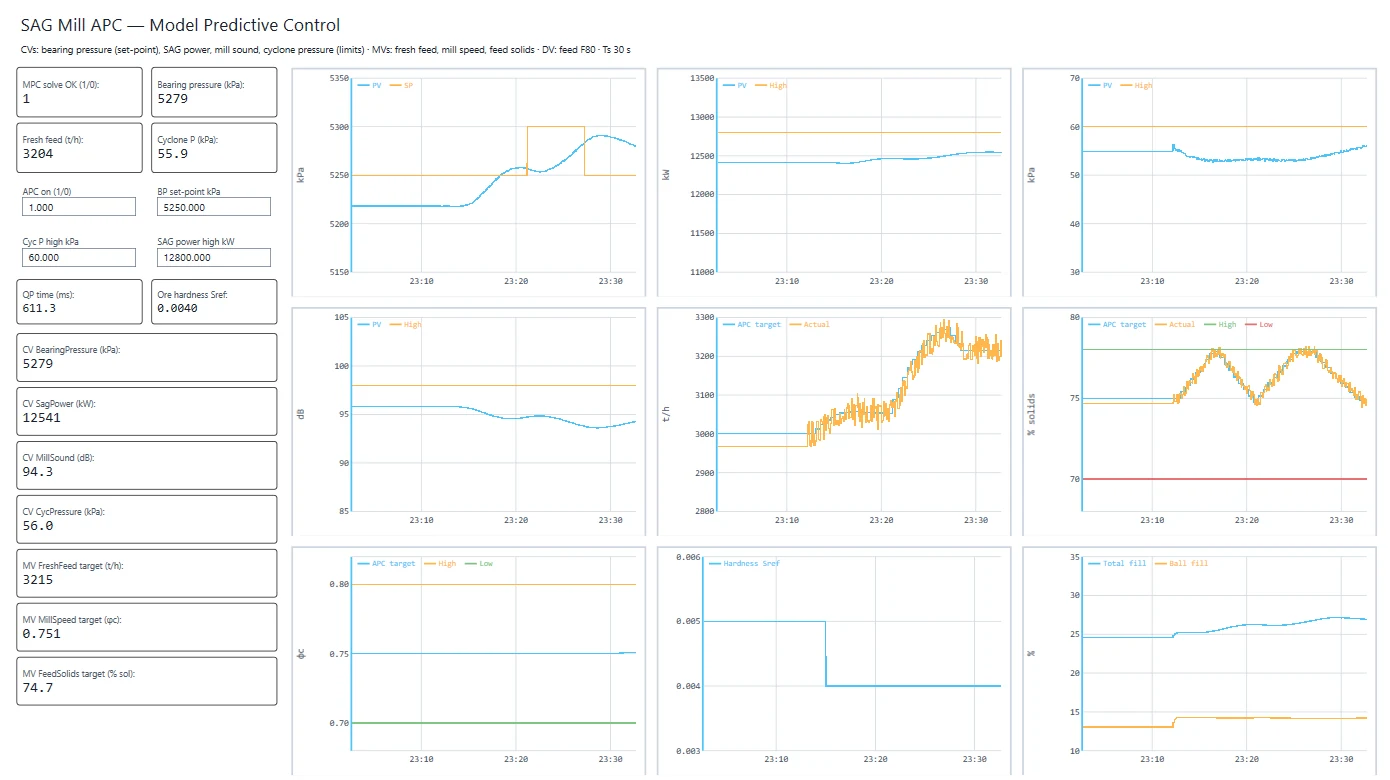
The screens below come from a live ProcessOpt run of our reference SABC circuit — SAG mill, pebble crusher, hopper, cyclones and two ball mills — with the twin and the controller running in real time. The plant is simulated, so what you see is what the twin produces, not a customer's data.
In this 30-minute run:
- 3,209 t/h fresh feed and 2,959 t/h to flotation, at product P80 210 µm
- 8.22 kWh/t specific energy and 254% circulating load, calculated live from the twin
- Ore turned 20% harder; bearing pressure still followed its set-point through a 5,250 → 5,300 → 5,250 kPa step
- Fresh feed rose from about 3,000 to 3,200 t/h while SAG power and cyclone pressure stayed inside their limits
Tap any screen to open it full size.
What the twin holds
- Mass balance — closed across every node in the SABC circuit, every cycle
- Soft sensors — mill filling, slurry density, and product P80 inferred between lab assays
- Power draw model — calibrated against measured motor power, not generic curves
- Breakage / classification — ore-specific parameters that update as the geology drifts
What you do with it
- What-if simulation — test setpoints, ore blends, ball charge, and circuit changes before touching the plant
- Operator training — the twin runs as a high-fidelity sim that mirrors the real circuit dynamics
- Early warning — overload risk, grind-out, and recycle build-up flagged minutes before they happen
- Audit trail — every controller move comes with a model-predicted outcome you can review after the fact
How it stays honest
Smart-instrument signals re-anchor the twin every cycle. The Rock Analyzer keeps the breakage model on the real feed. Mill load, motor power, and bearing pressure correct the filling model. Lab assays correct the classification model when they arrive. The twin is never allowed to drift more than a few percent from reality before it is pulled back.
Deployment
On-prem, edge-capable. No cloud dependency. Calibration kit ships with the install; first-pass twin online inside two weeks from historian access.
See how this instrument performs on your circuit.
Request a demo