
Thickener Control: Bed Mass, Underflow Density and Flocculant Loops
Holding inventory, density and clarity together, and returning more water to the plant
The three loops
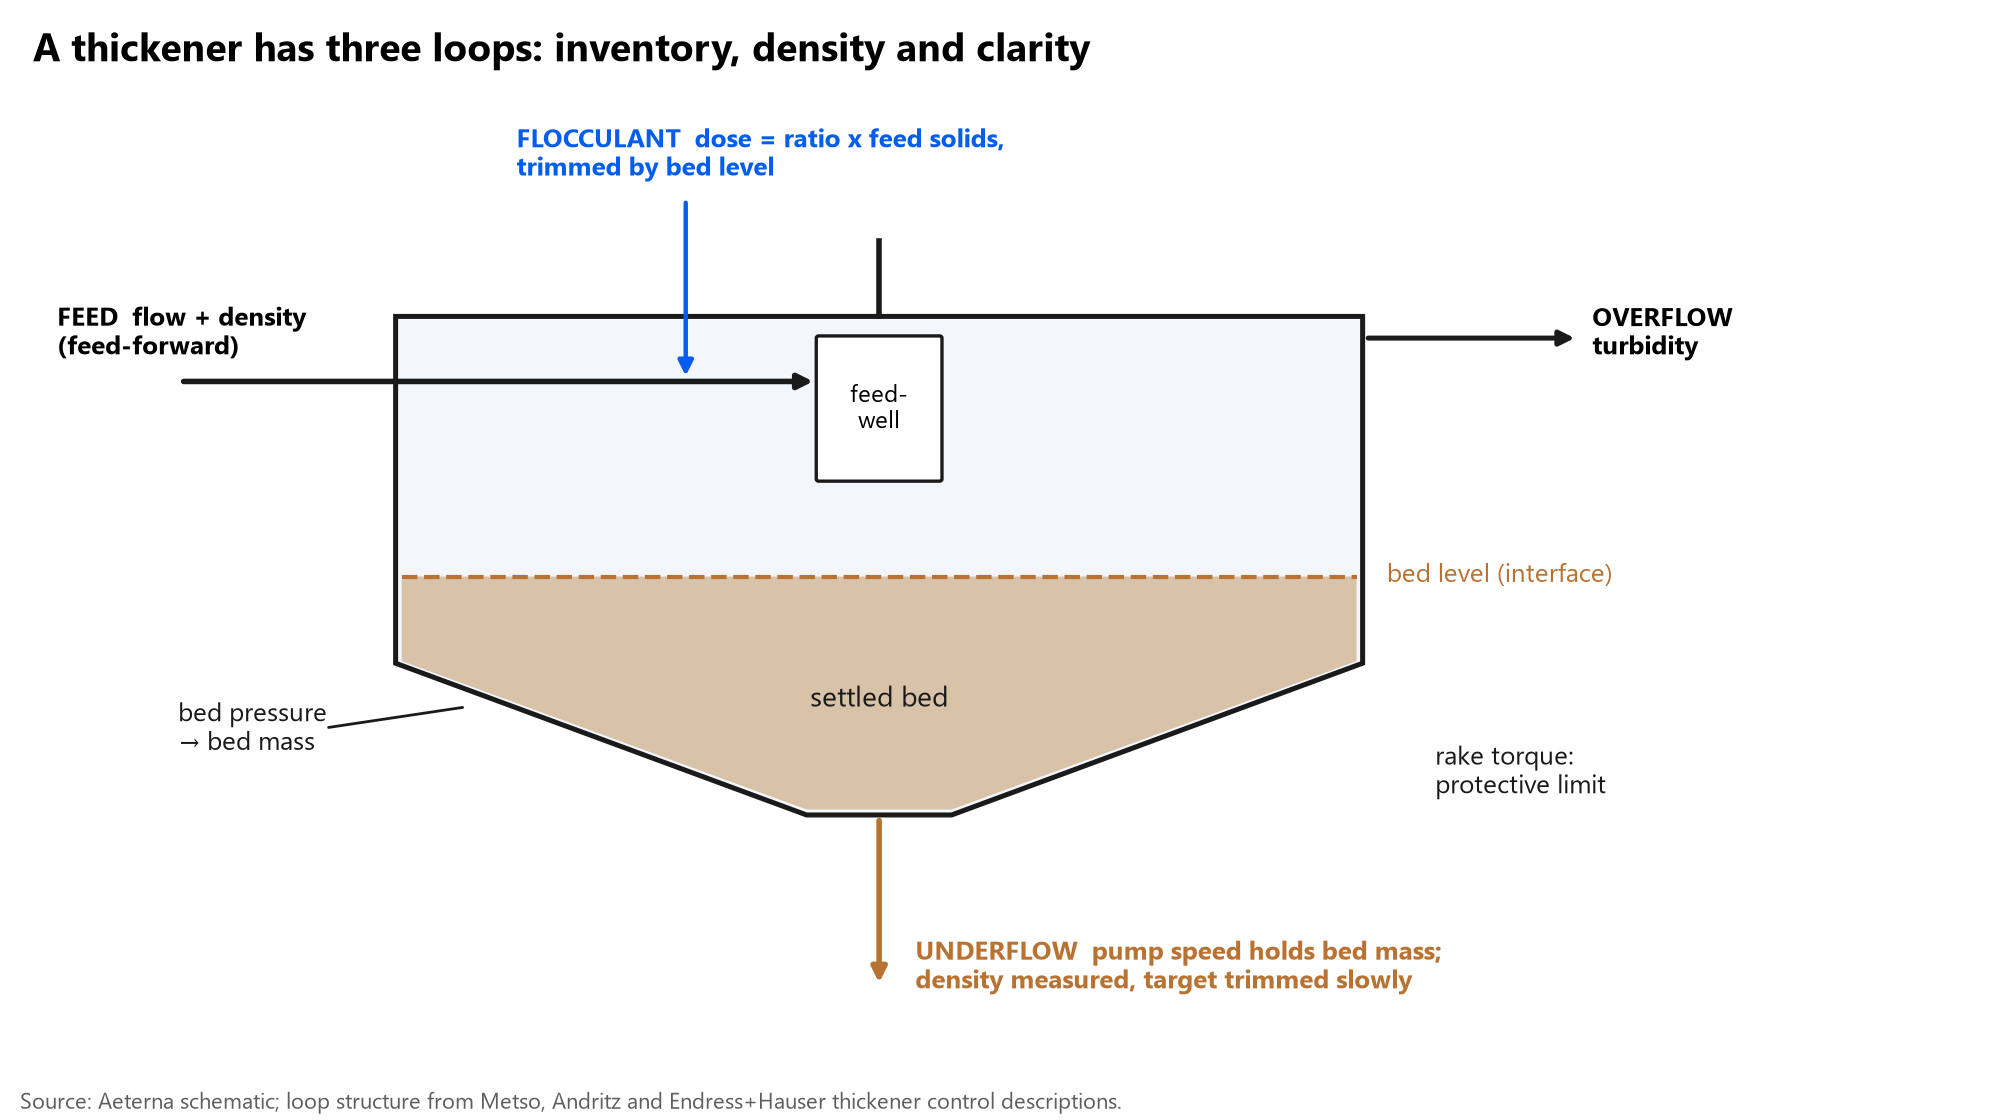
Inventory: the mass of solids in the thickener, measured as bed pressure near the cone and converted to bed mass. Kosonen et al. describe bed mass as a very robust measurement and a good control variable. Underflow pump speed is its natural handle.
Density: underflow % solids, measured by a density gauge on the underflow line. It depends on how long solids stay in the bed and how they consolidate, so it responds to pump changes over hours, not minutes. Clarity: overflow turbidity or solids, set mainly by flocculant dose and feedwell performance, with bed level (interface) as an early signal. Rake torque is the protective limit: it rises with bed mass and yield stress and must never be exceeded.
Why density-only control cycles
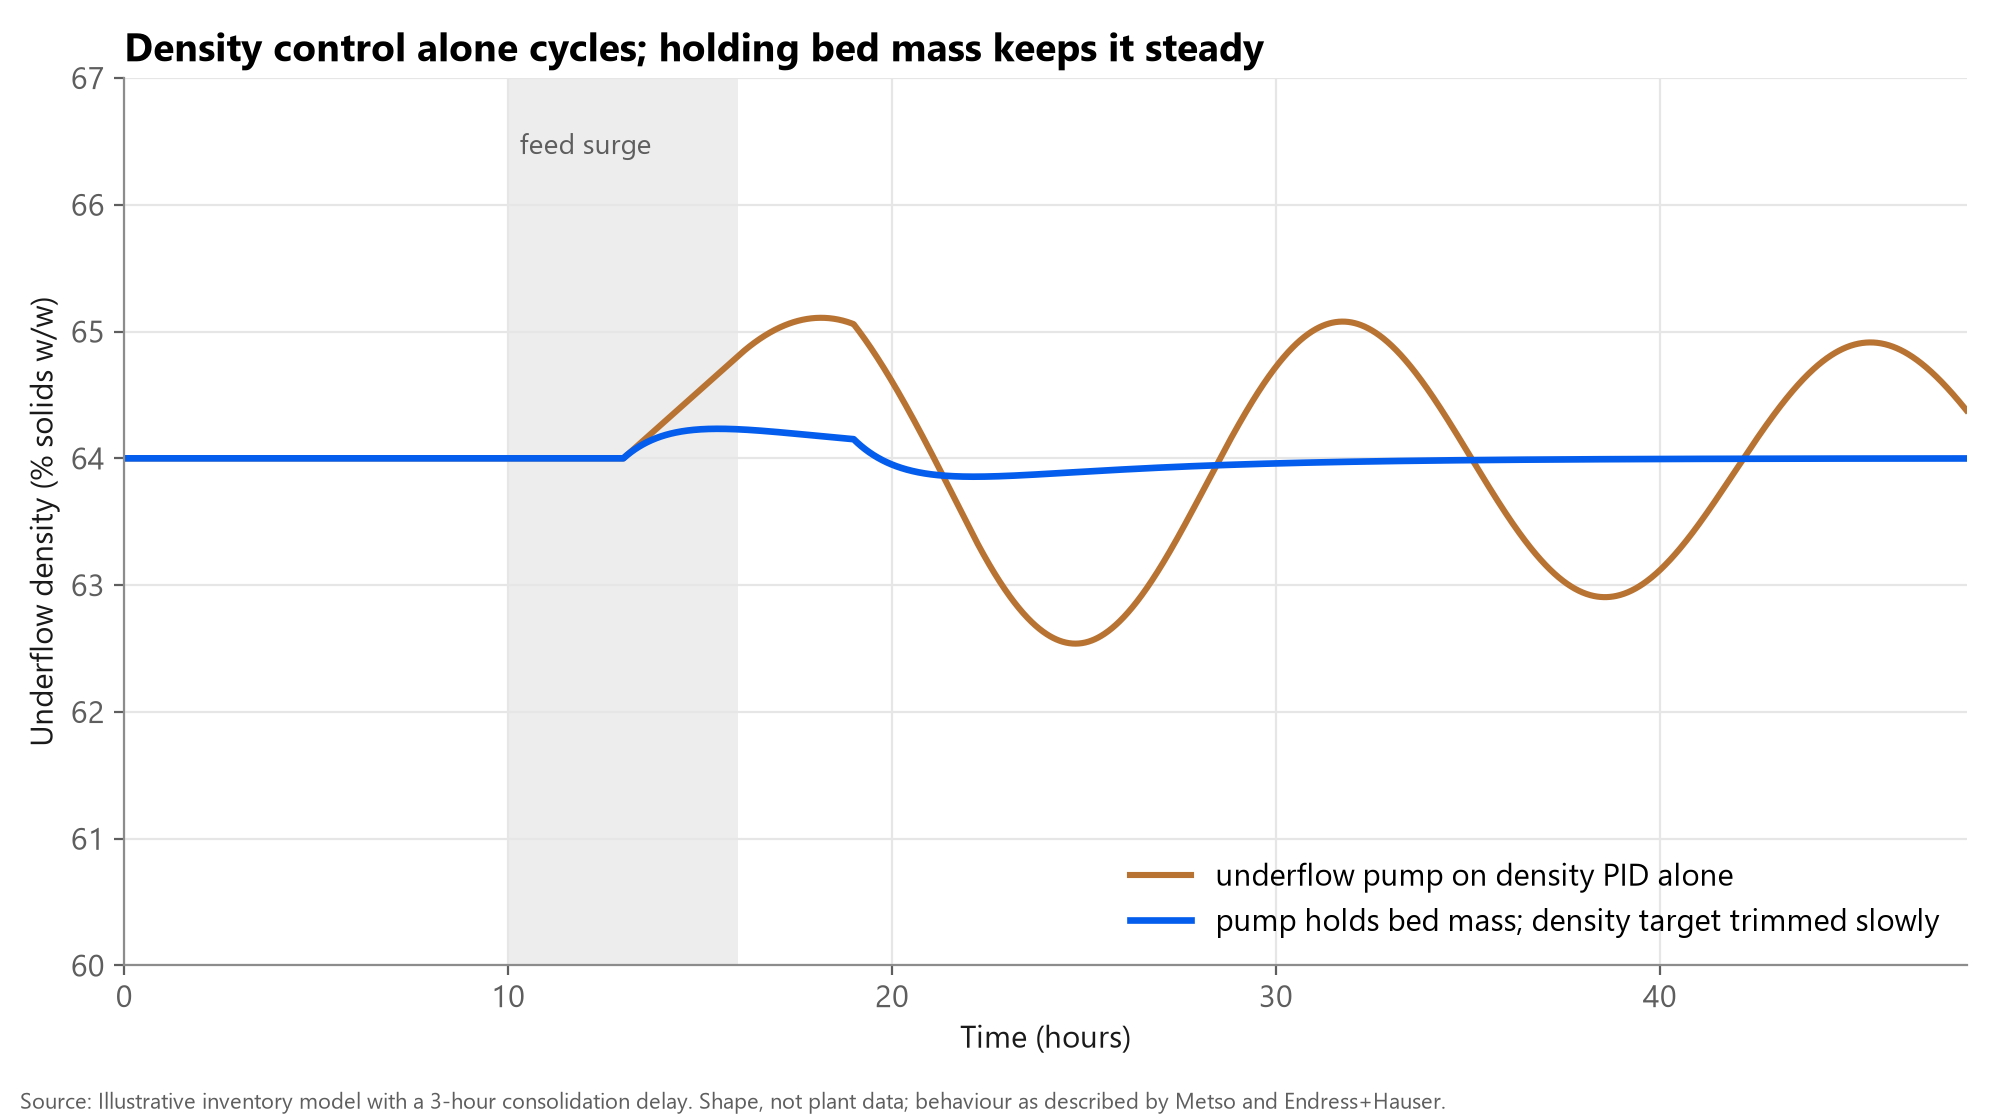
If the underflow pump is driven directly by a density PID, the controller sees low density, slows the pump, inventory builds, density eventually rises hours later, the controller speeds the pump, inventory falls, and the cycle repeats. Metso describes this as cyclic loading and emptying caused by the dead time in the system.
The robust structure keeps inventory constant with the pump (bed mass or bed level feedback), isolates the thickener from pipeline disturbances with flow control, and trims the bed-mass target slowly to reach the density target. Model predictive controllers (Metso Thickener Optimizer, Andritz Metris ACE, FLSmidth) do the same multivariable job: underflow density as the primary objective, overflow solids second, with minimal flocculant.
Flocculant: ratio, feed-forward and trim
Flocculant demand scales with solids, so the base dose should be a ratio to feed solids (g/t), calculated from feed flow and density; this predicts dose from what is about to enter rather than reacting to the bed. A slow trim from bed level or overflow turbidity corrects for ore changes.
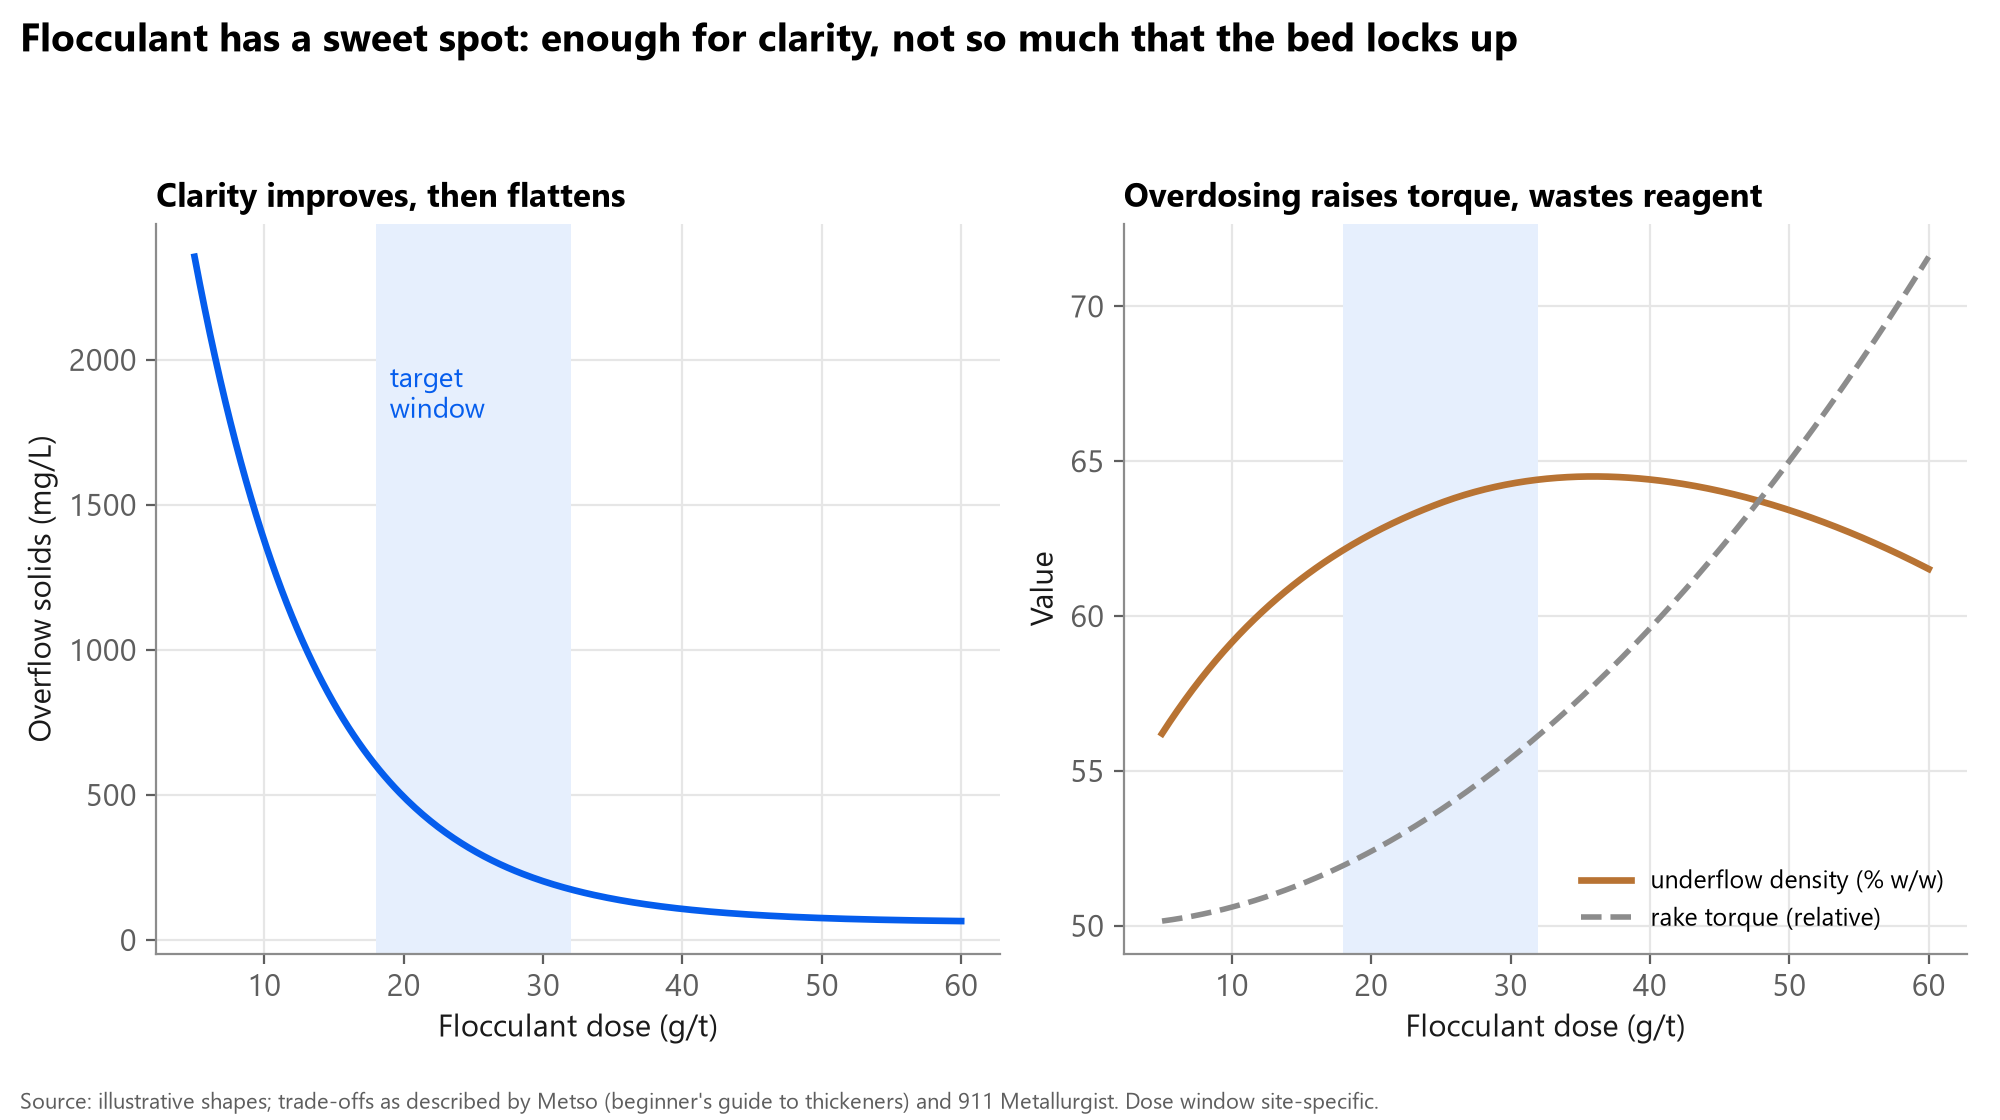
Too little flocculant gives a dirty overflow, a thin underflow and a rising interface. Too much gives a clear overflow but a dense, high-yield-stress bed, higher rake torque and a risk of plugging the underflow line, while wasting reagent. Feedwell dilution and design often decide how effective each gram is.
Why underflow density matters: water
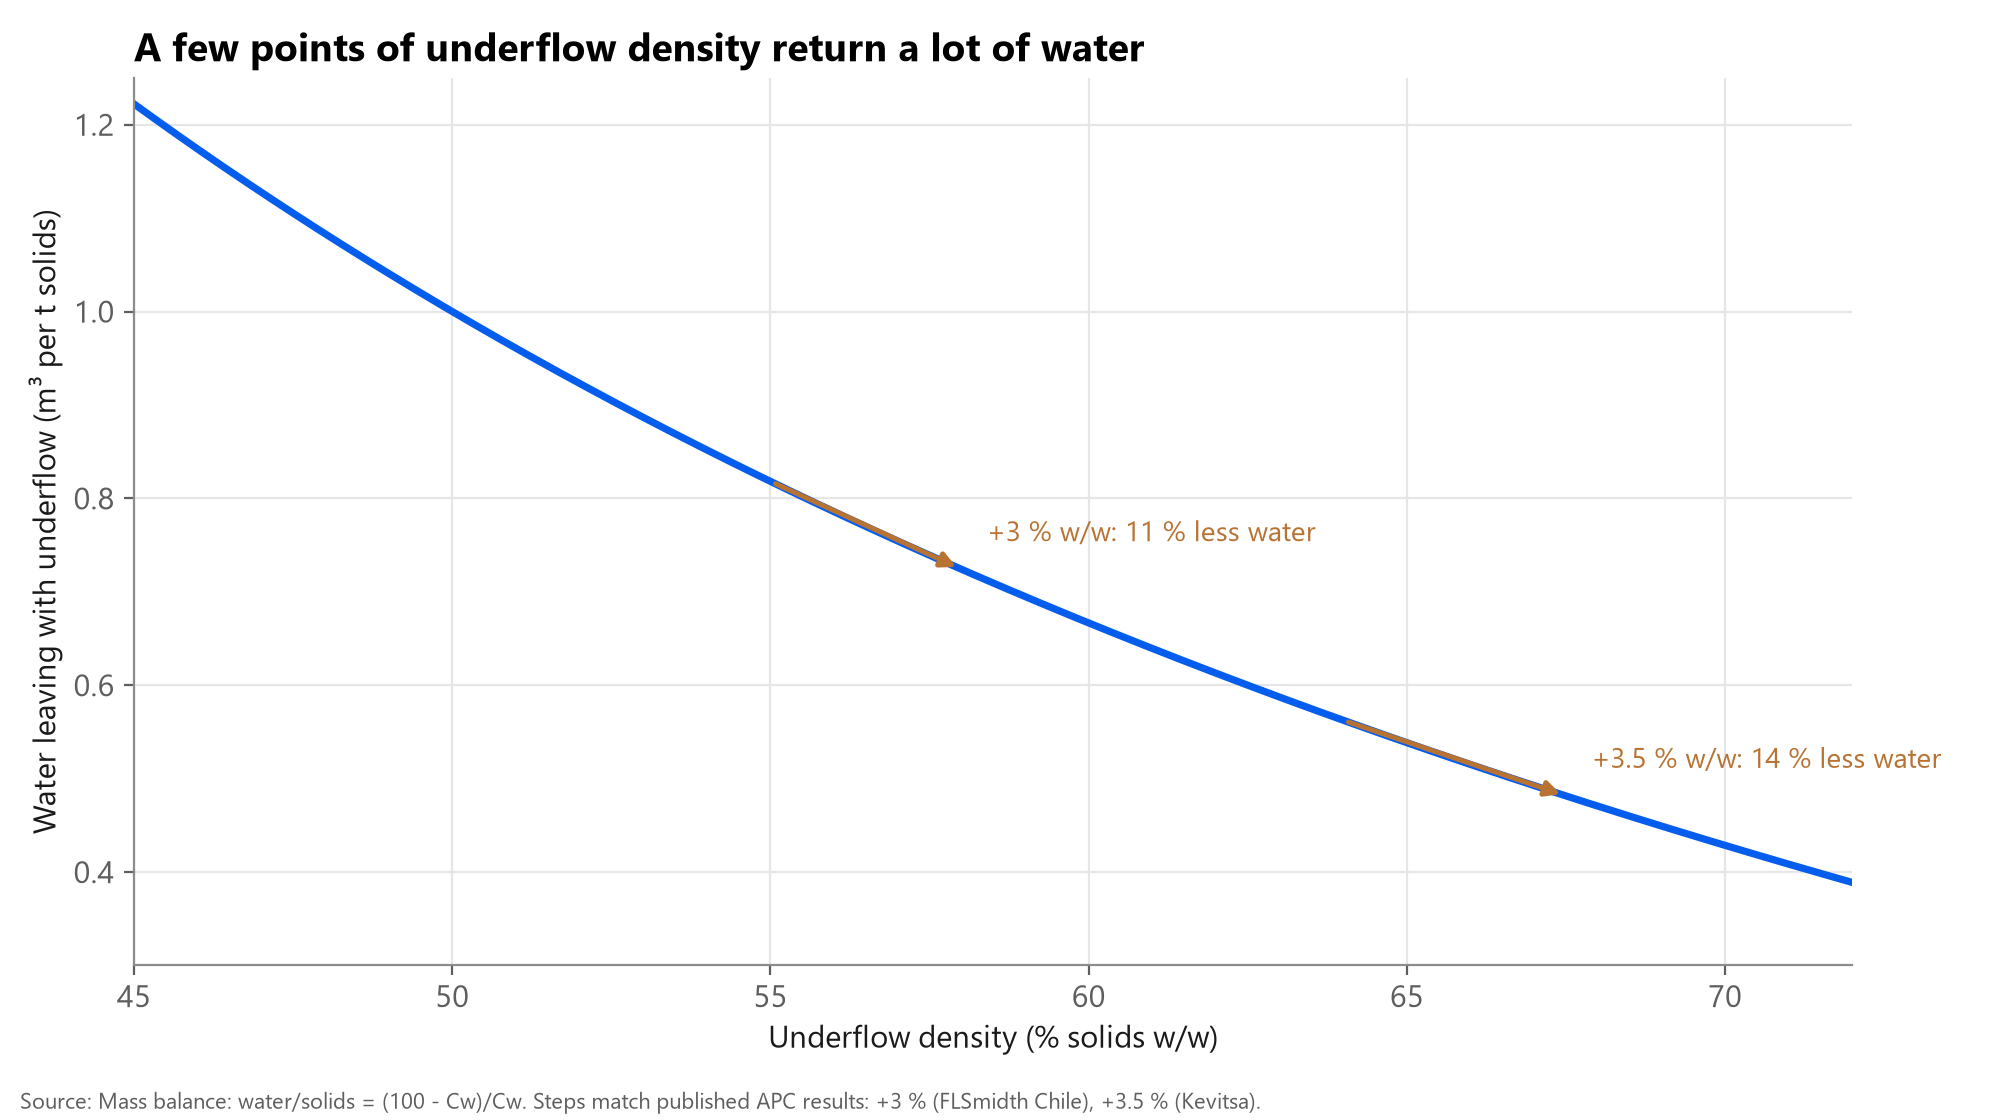
Water leaving with the underflow is (100 - Cw)/Cw cubic metres per tonne of solids. Raising underflow from 55 to 58 % w/w cuts it by 11 %; from 64 to 67.5 % by 14 %. That water returns to the process instead of going to the tailings facility, which reduces fresh water draw, pumping and evaporation losses, and tailings dam volume: a real sustainability gain, tied to a measurable mechanism.
Stable density also matters downstream: paste and filtration need consistent feed, and tailings pipelines are designed for a density band.
Published results
| Site | Result | Source |
|---|---|---|
| Kevitsa (Ni-Cu, Finland) | -24 % underflow density variation; +3.5 % w/w solids | Metso case study (vendor) |
| Chilean Cu-Mo tailings thickeners | +3 % w/w underflow; -15 % flocculant; -14 % water to tailings | FLSmidth performance study (vendor) |
| Loulo gold mine, Mali | Lower density and pH variability; -9.3 % flocculant, -6.6 % lime | CIM / OneMine paper |
| Prominent Hill tailings thickener | +2-3 % underflow density; significant flocculant reduction | AusIMM Mill Operators' 2012 |
| Yara Siilinjarvi paste thickeners | Operated in 66-68 % solids window with MPC | Metso case study (vendor) |
Estimated ROI of thickener levers
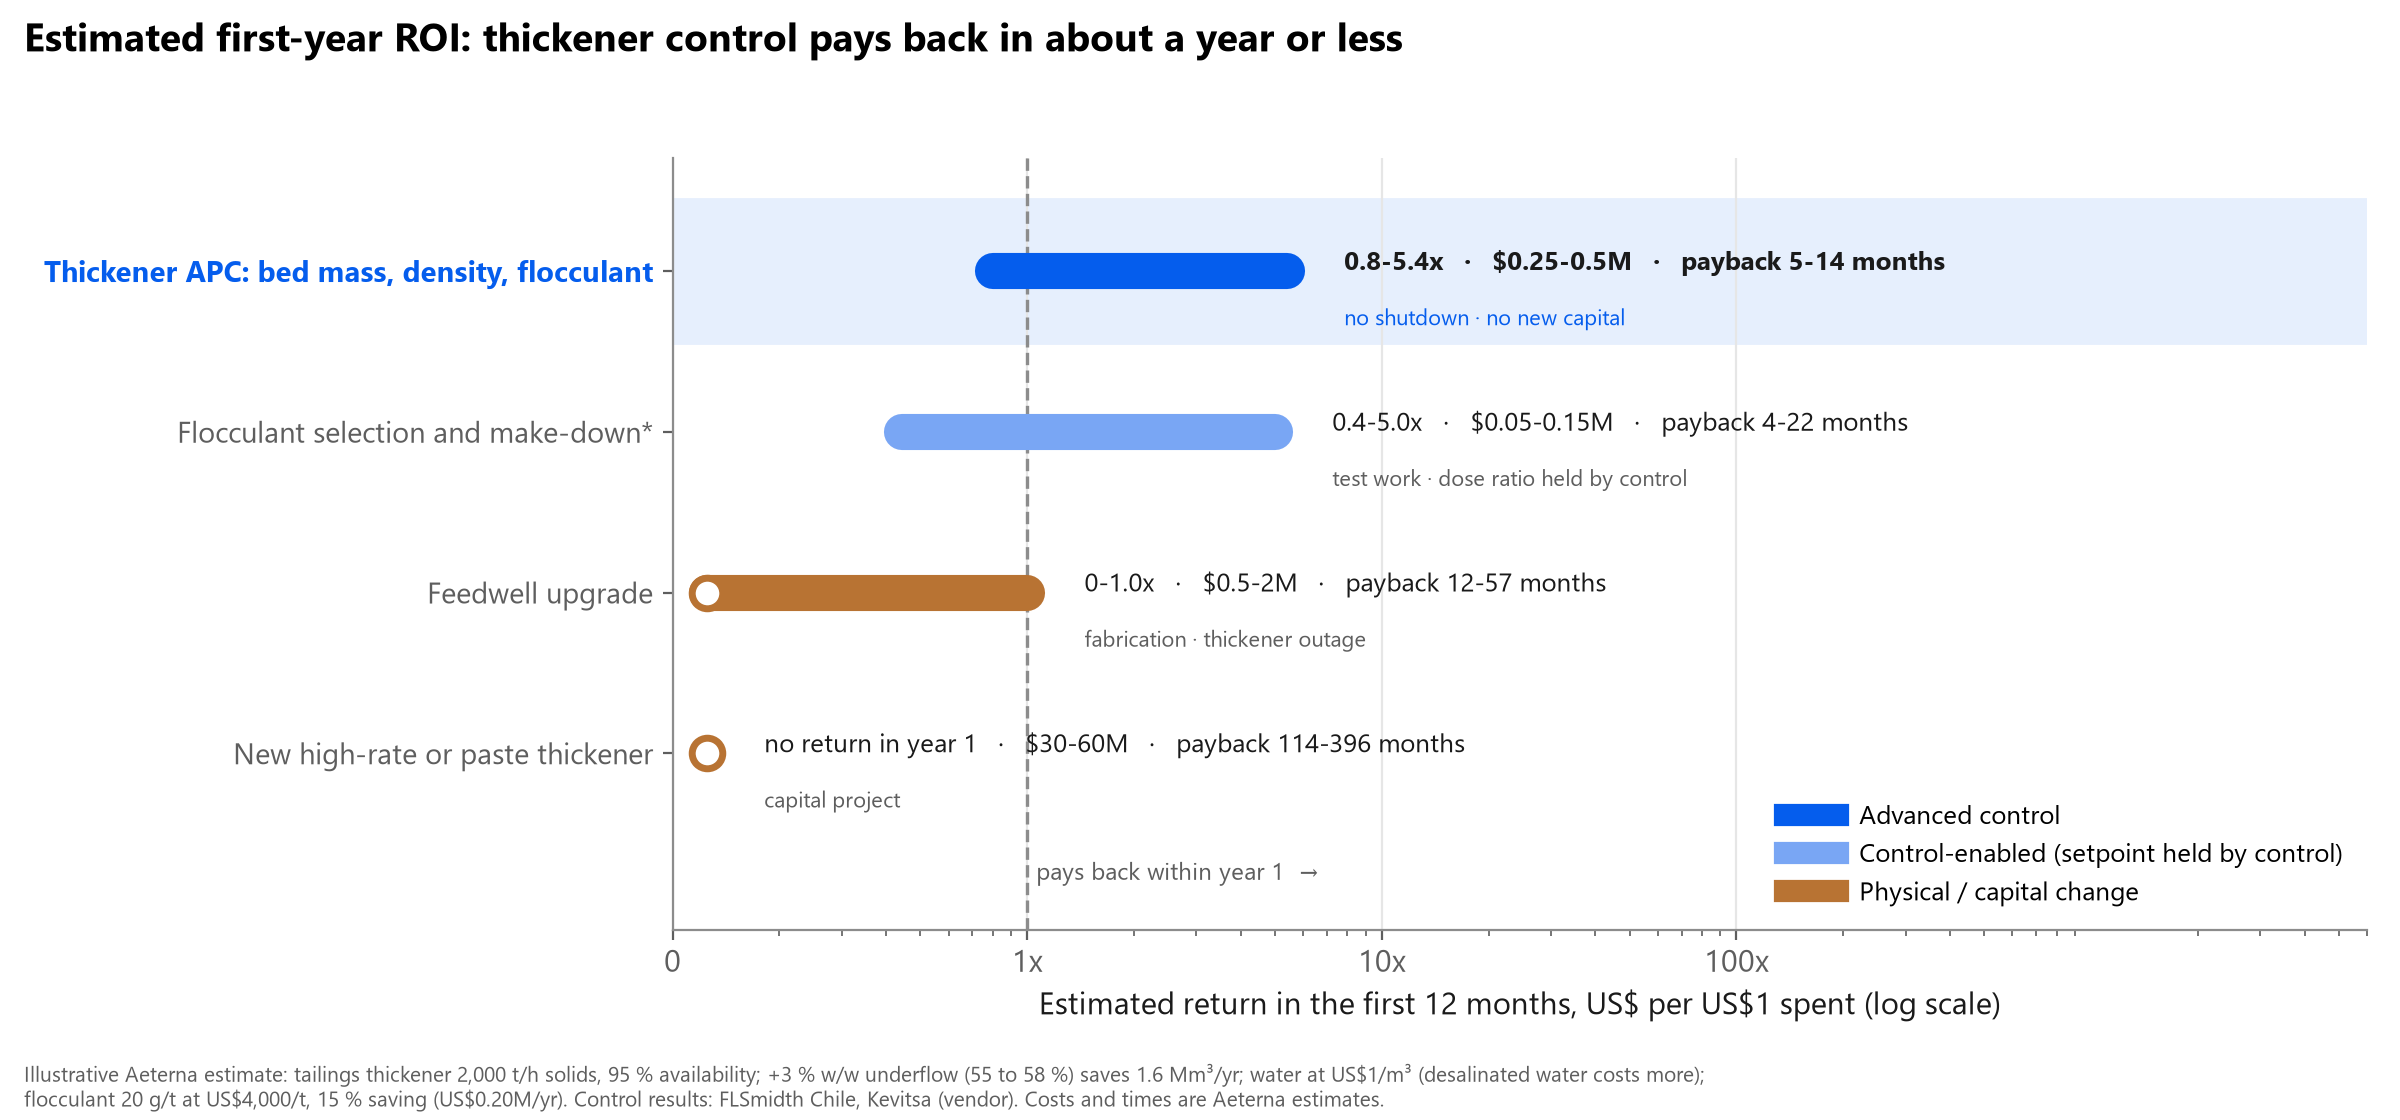
On an illustrative tailings thickener (2,000 t/h solids, 95 % availability), +3 % w/w underflow returns about 1.6 million m³ of water a year, worth about US$1.6M at US$1/m³, plus about US$0.20M a year from 15 % less flocculant (20 g/t at US$4,000/t). Thickener APC returns roughly 1-5x its cost in year one with a payback of about 5-14 months. Flocculant selection held by control is also cheap; a feedwell upgrade pays back in one to five years; a new thickener takes many years on water value alone.
Where water is scarce or desalinated (US$2-5/m³ or more), the control return scales up in proportion. Costs and times are Aeterna estimates.
| Lever | Annual value | Est. cost incl. lost production | Time to value | Payback | Year-1 return |
|---|---|---|---|---|---|
| Thickener APC: bed mass, density, flocculant | 0.8-1.8 US$M/yr | $0.25-0.5M | 3-6 months | 5-14 months | 0.8-5.4x |
| Flocculant selection and make-down* | 0.1-0.3 US$M/yr | $0.05-0.15M | 2-4 months | 4-22 months | 0.4-5.0x |
| Feedwell upgrade | 0.4-1 US$M/yr | $0.5-2M | 6-12 months | 12-57 months | 0-1.0x |
| New high-rate or paste thickener | 2-4 US$M/yr | $30-60M | 24-36 months | 114-396 months | 0x |
Aeterna angle
ProcessOpt holds bed mass with the underflow pump, trims the density target, doses flocculant in ratio to feed solids with a bed-level trim, and keeps rake torque inside its limit, with operator-readable rules or MPC where a model pays. The pitch is water returned and steady downstream feed, measured against a baseline.
Common misconceptions
- 'Control density with the pump directly.' The dead time makes it cycle; control inventory first.
- 'More flocculant is safer.' It raises torque and cost and can plug the underflow.
- 'Bed level and bed mass are the same.' Level shows the interface; mass shows inventory; both are useful.
- 'Thickener gains are small.' A few points of density return large volumes of water.
Where sources disagree or are uncertain
- Most quantified results are vendor case studies; Loulo and Prominent Hill are conference papers.
- Typical flocculant doses vary widely by ore and are not benchmarked in open sources; 20 g/t is an assumption.
- Water value depends strongly on site: from under US$1/m³ to several dollars for desalinated water.
- Figures 2 and 3 are illustrative shapes, not plant data.
Ask for a thickener review: we look at your bed, density and flocculant data and estimate the water you could return.
Talk to an engineerSources
- Paste thickener control (Kosonen et al.), Australian Centre for Geomechanics, Paste conference
- Advanced thickener control, Metso blog
- Kevitsa: ACT thickener optimizer, Metso case study
- Yara Siilinjarvi: ACT thickener optimizer, Metso case study
- Performance study: tailings thickener APC, Chile, FLSmidth, 2023
- Implementation of an advanced thickener underflow density control at Loulo gold mine, Mali, CIM / OneMine
- Tailing thickener operability and control improvements at Prominent Hill, AusIMM Mill Operators' Conference, 2012
- Thickener optimization (bed mass, flocculant feed-forward), Endress+Hauser
- Metris addIQ ACE thickener, Andritz