
Sound Analyzer: Listening to the SAG Mill, with Fill Analyzer and Ball Counter
What the mill's sound says about fill, impacts and media, and how three instruments turn it into numbers a controller can use
Why listen to a SAG mill
A SAG mill is a tumbling mill where rock and steel balls are both the grinding media. Its performance depends on three things the operator cannot see directly: how full the mill is (total fill Jt, % of mill volume), how much of that is steel (ball fill Jb), and where the falling charge lands - on the toe of the charge, where it breaks rock, or on bare shell liner above it, where it breaks liners and balls.
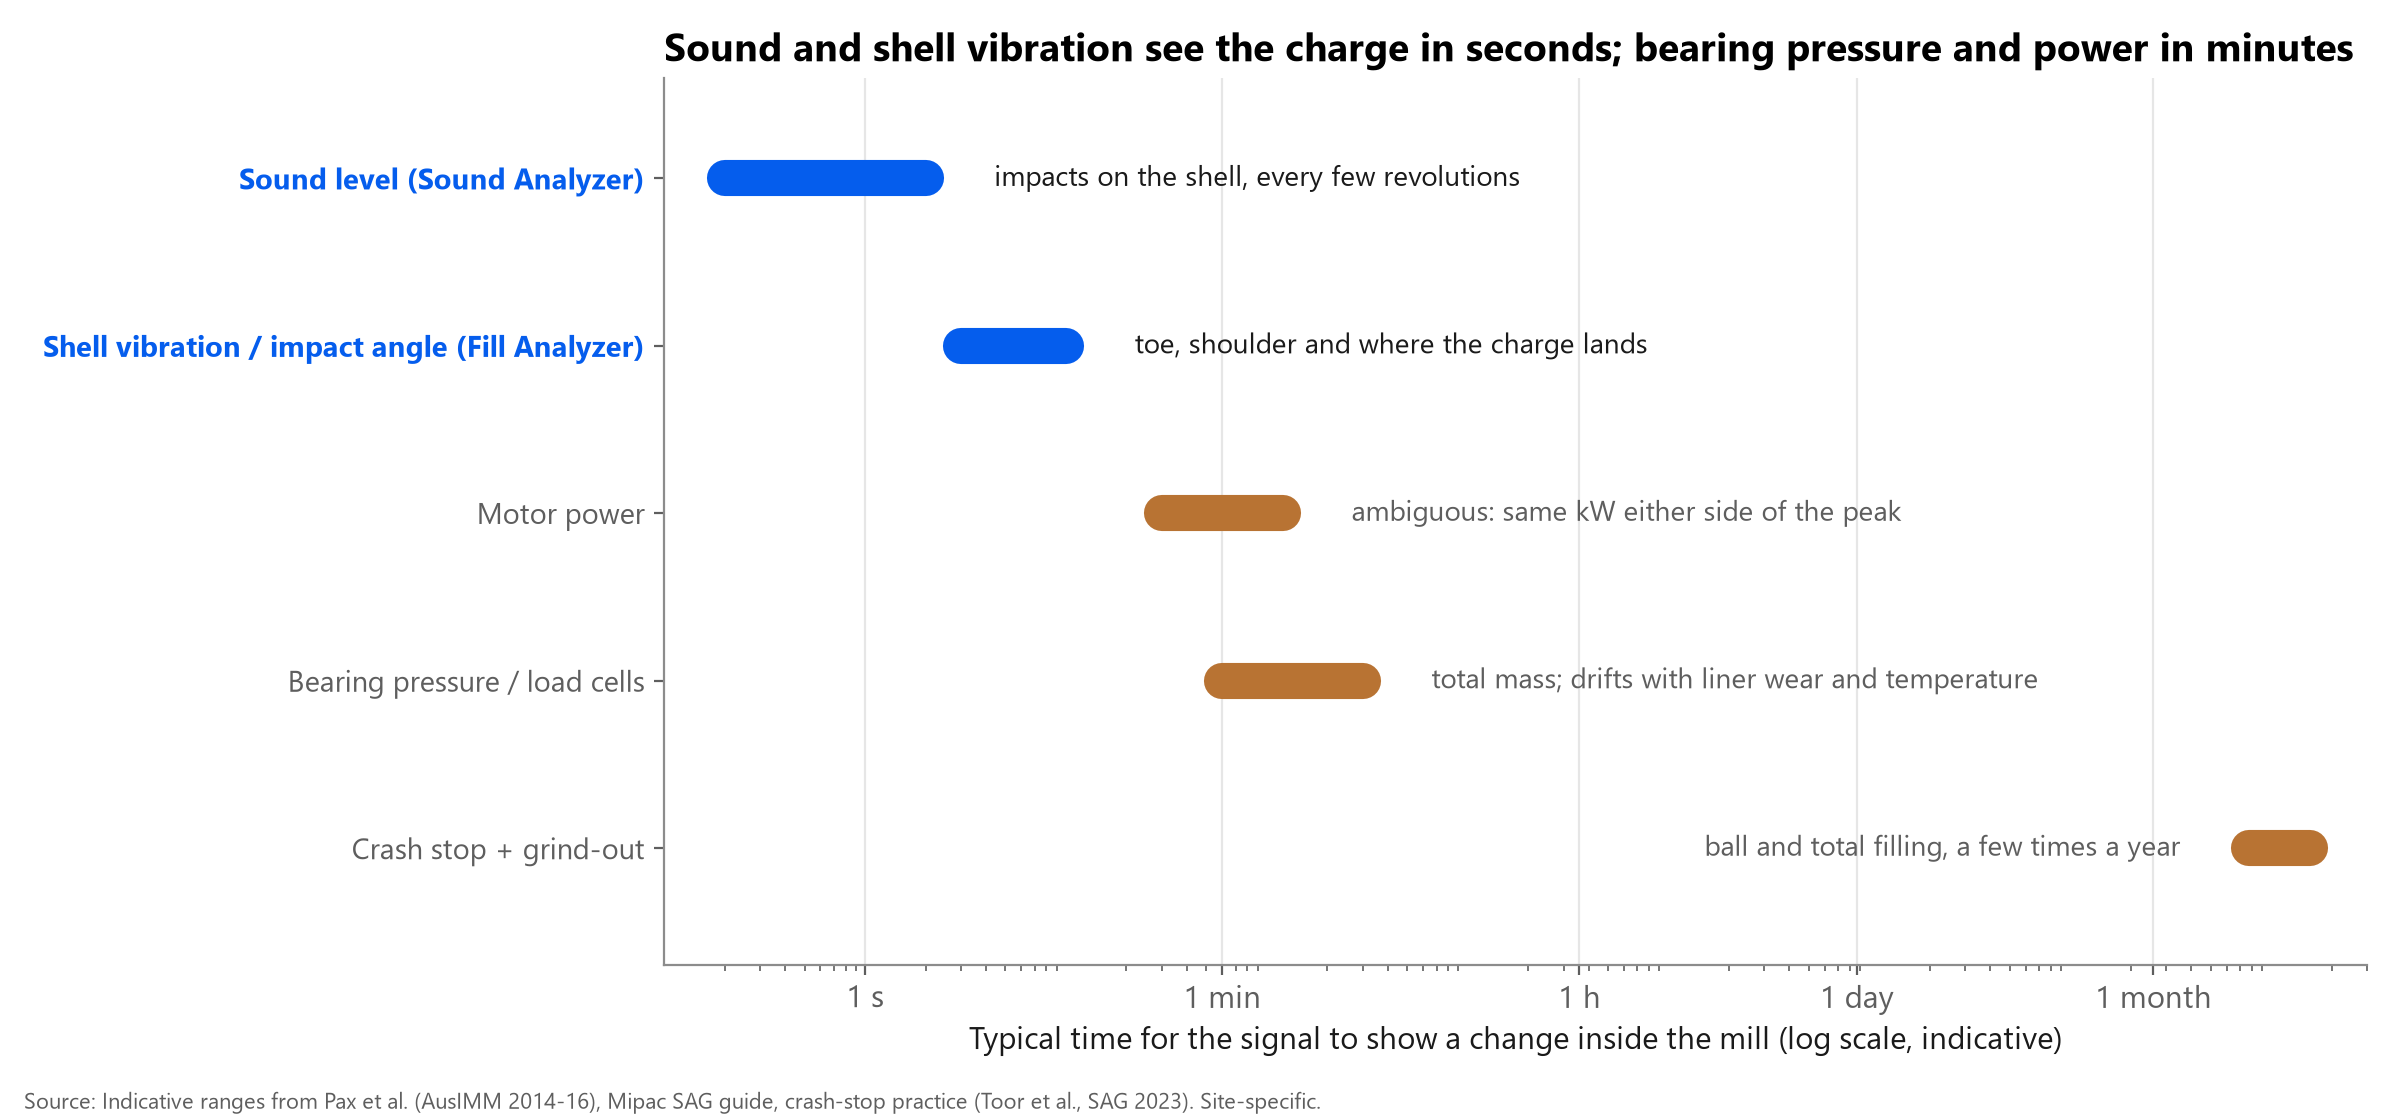
The conventional signals are bearing pressure (or load cells) and motor power. Both are useful and both are slow and ambiguous. Bearing pressure weighs everything on the bearings, so liner wear and relines shift its zero, and at MMG Century it was described as noisy, temperature-sensitive and lacking useful sensitivity (Pax et al., 2014). Power peaks at an intermediate filling, so the same kilowatts can mean the mill is under-filled or overloading.
Sound arrives in seconds. When balls strike bare shell the mill rings; as the charge builds and slurry cushions impacts, the sound becomes muffled. Experienced operators use exactly this - and early 'electronic ear' systems tried to automate it.
What the literature says about acoustic monitoring
- Early systems used one or two microphones; one patent describes the two-point method as crude because it samples intensity at only two fixed points.
- Practitioner experience is mixed: 'good for alarm but not for control' is a common view, with others reporting that well-maintained ears indicate load level well.
- MMG Century replaced failing load cells with a 12-microphone array as a load proxy; at 1,100 t/h the cyclic acoustic signal was used to stabilise the mill through feed water, after a >25 % throughput push had exposed new instabilities (Pax et al., MetPlant 2015).
- At Cannington, Metso's SmartEar acoustics and an online model-based charge estimator were compared with bearing pressure; the authors concluded that redundant load estimates give more confidence (La Rosa et al., MetPlant 2008).
- Shell-mounted vibration sensors (e.g. Molycop MillSlicer) report impact angle and toe angle; an IMPC 2024 case held impact angle around 135 degrees through a liner campaign by trimming mill speed.
- Model-based estimators using the Morrell power model and a Kalman filter can estimate both Jt and Jb (Toor et al., SAG 2023; Iglesias et al., IMPC 2014; Herbst et al., 1990).
The Sound Analyzer
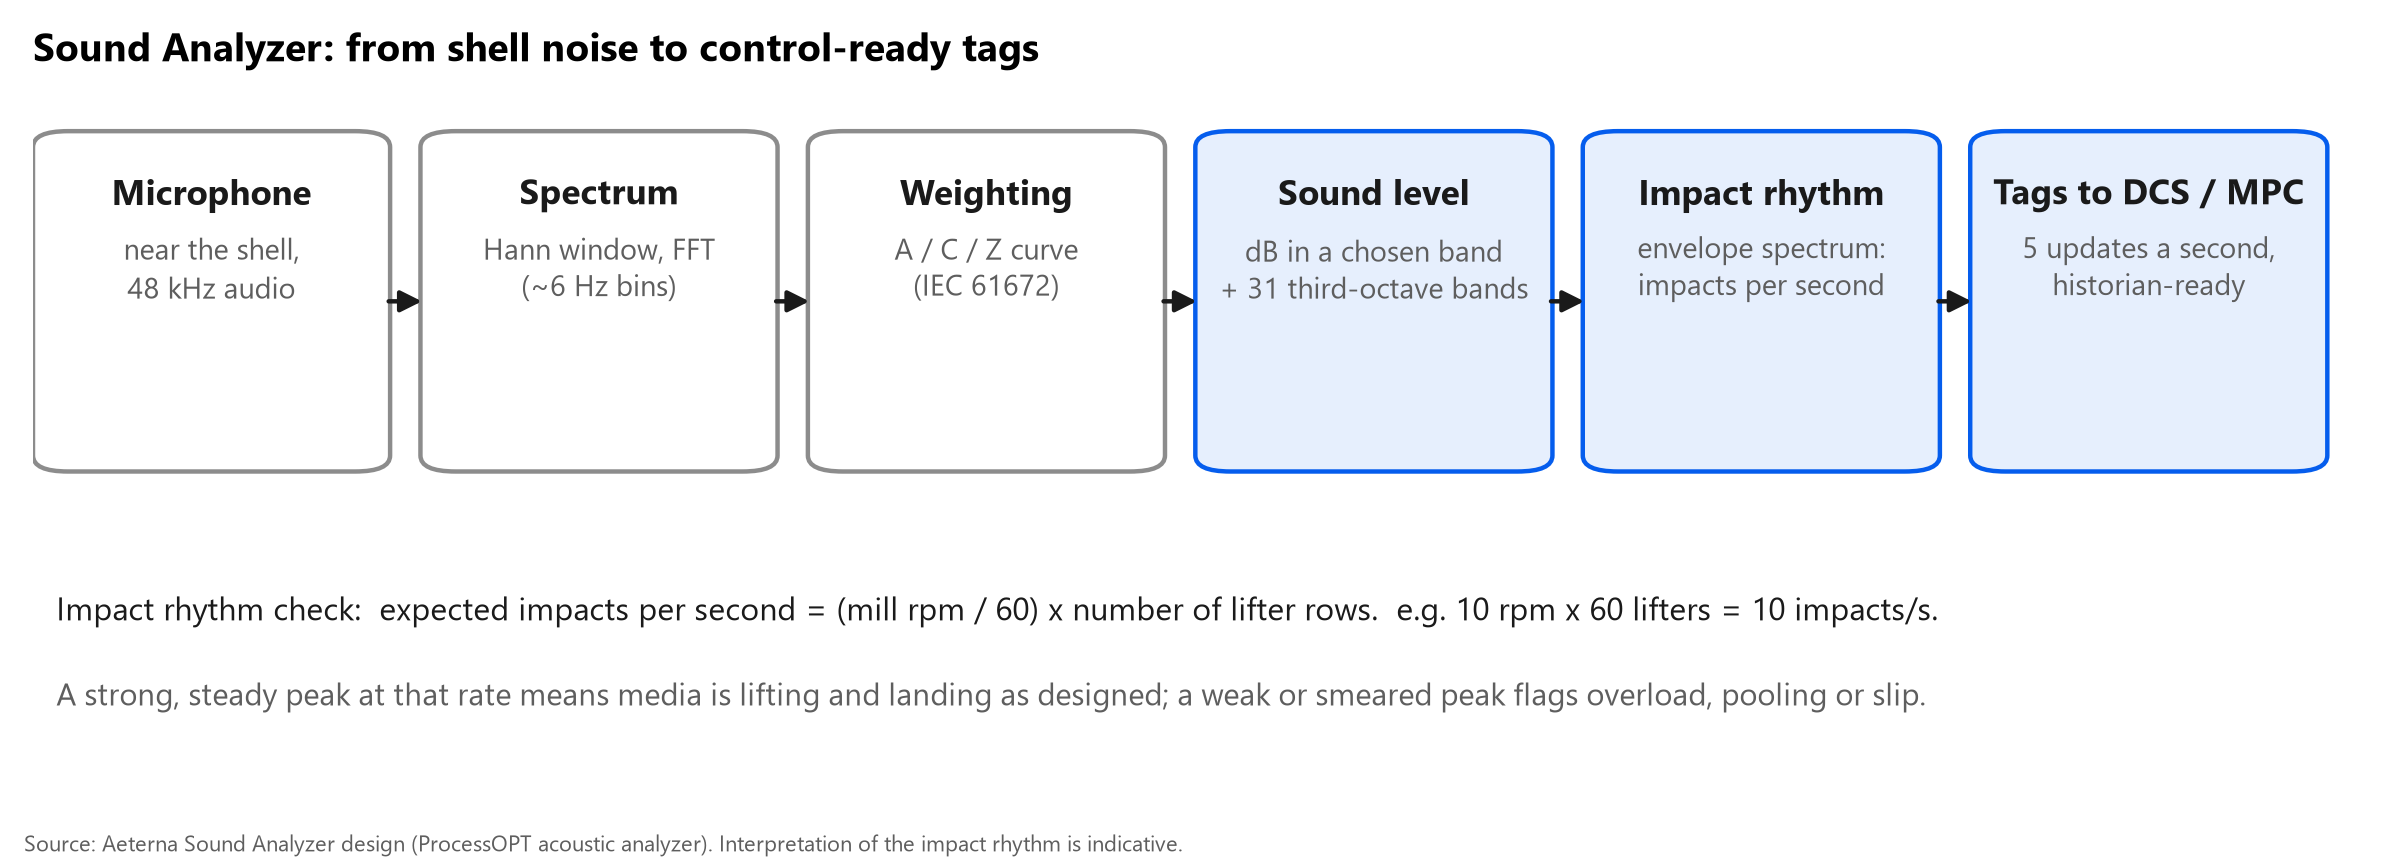
The Sound Analyzer listens to a microphone near the mill shell and publishes, five times a second, the numbers a metallurgist can reason with. The audio is windowed and transformed into a spectrum (about 6 Hz resolution), weighted with a standard A, C or Z curve, and integrated into a sound level in dB over a chosen frequency band. The same spectrum is split into 31 third-octave bands from 20 Hz to 20 kHz, so changes in character - ringing versus muffled - are visible, not just changes in loudness.
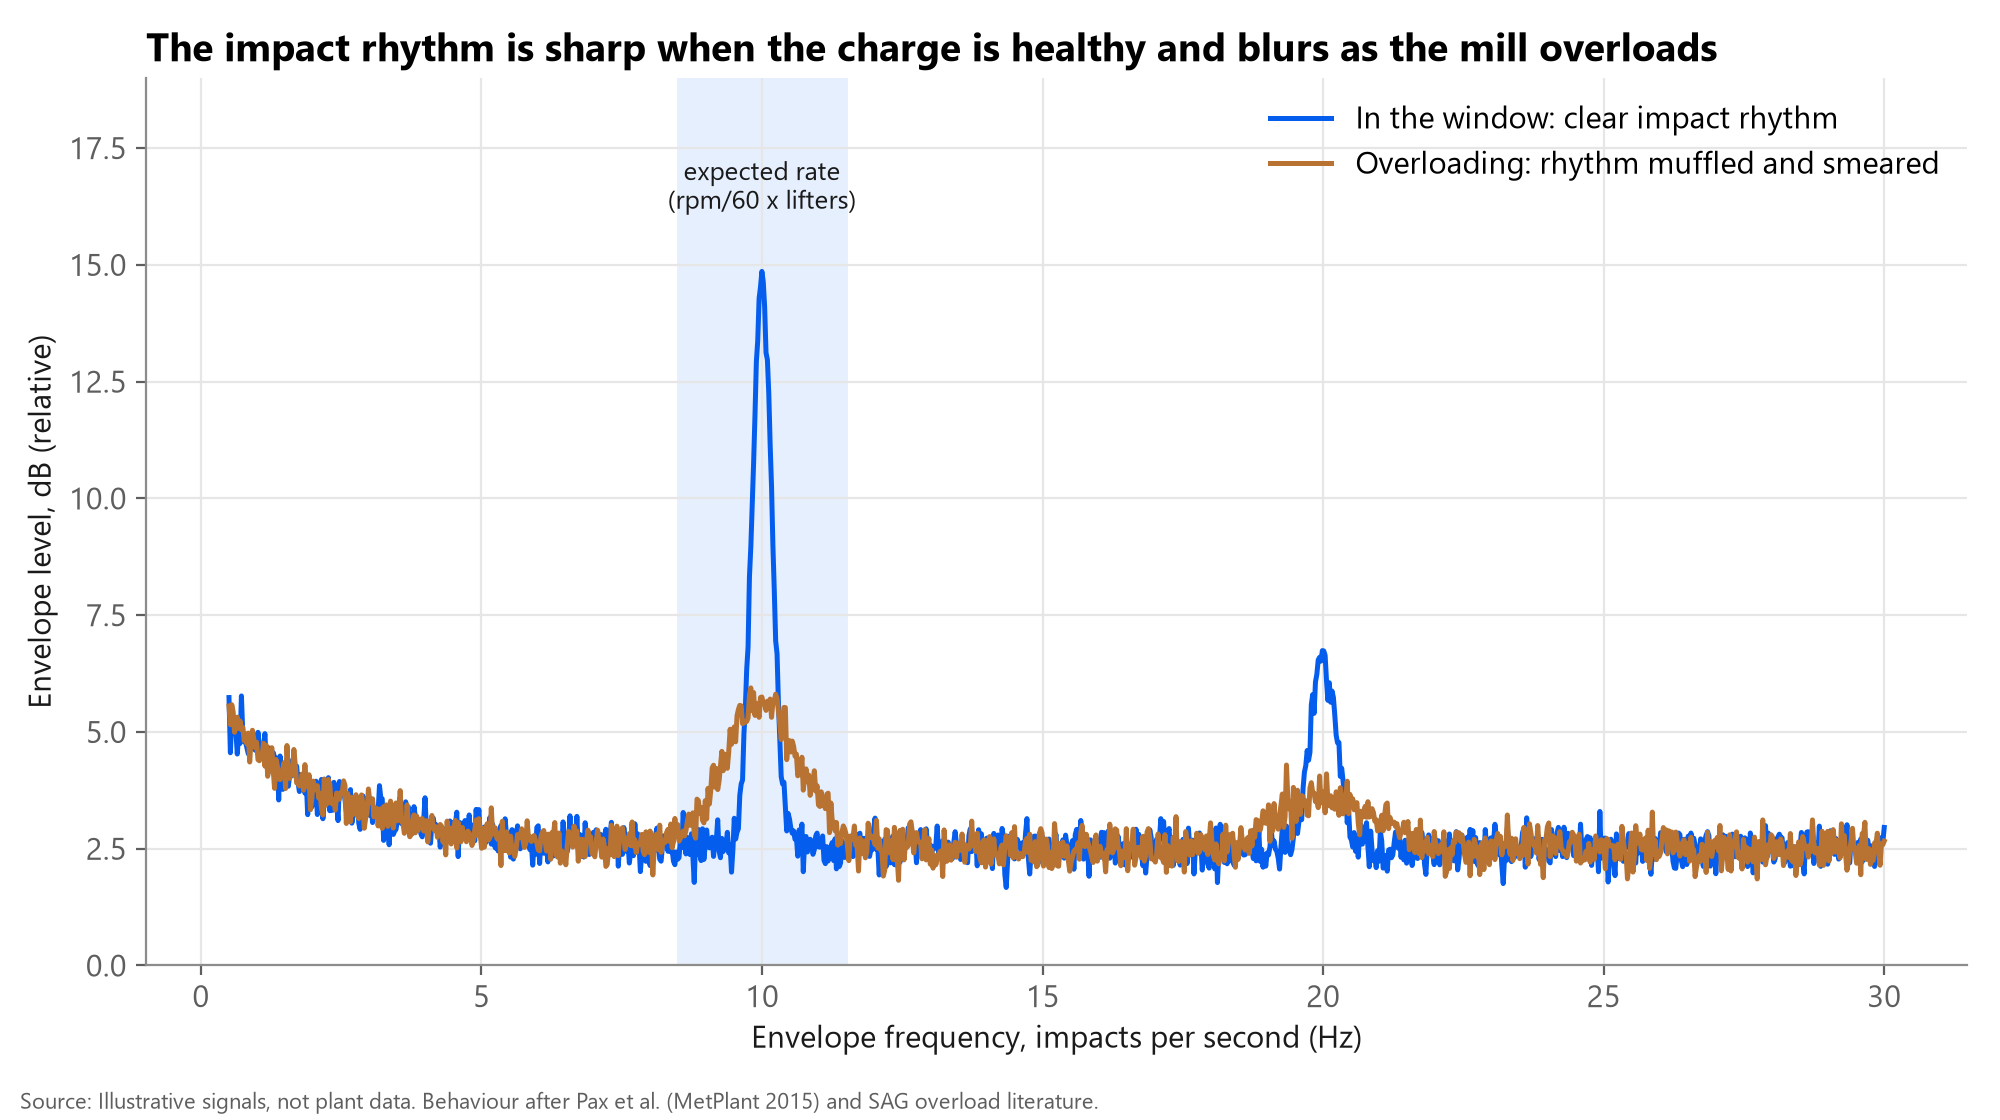
The second output is the impact rhythm. Each lifter row throws media once per pass, so impacts repeat at (mill rpm / 60) x number of lifter rows; a 10 rpm mill with 60 lifter rows gives 10 impacts a second. The analyzer demodulates the 500-5,000 Hz band into an envelope and looks for that repetition. A strong, narrow peak means media is lifting and landing as designed; a weak or smeared peak points to overload, pooling or slip. The search can lock to the kinematic rate or find the peak automatically.
Tags go to the DCS and historian like any other instrument, and a microphone can also contribute its impact position to the Fill Analyzer's trajectory check.
Reading the impact rhythm
Figure 3 shows the idea with illustrative signals. In the operating window the envelope spectrum has a sharp peak at the expected impact rate and its harmonic. As the mill fills and slurry cushions the charge, the peak drops and broadens. A falling sound level with a smearing rhythm is an earlier, clearer overload warning than power flattening a few minutes later.
Fill Analyzer: what is inside the mill
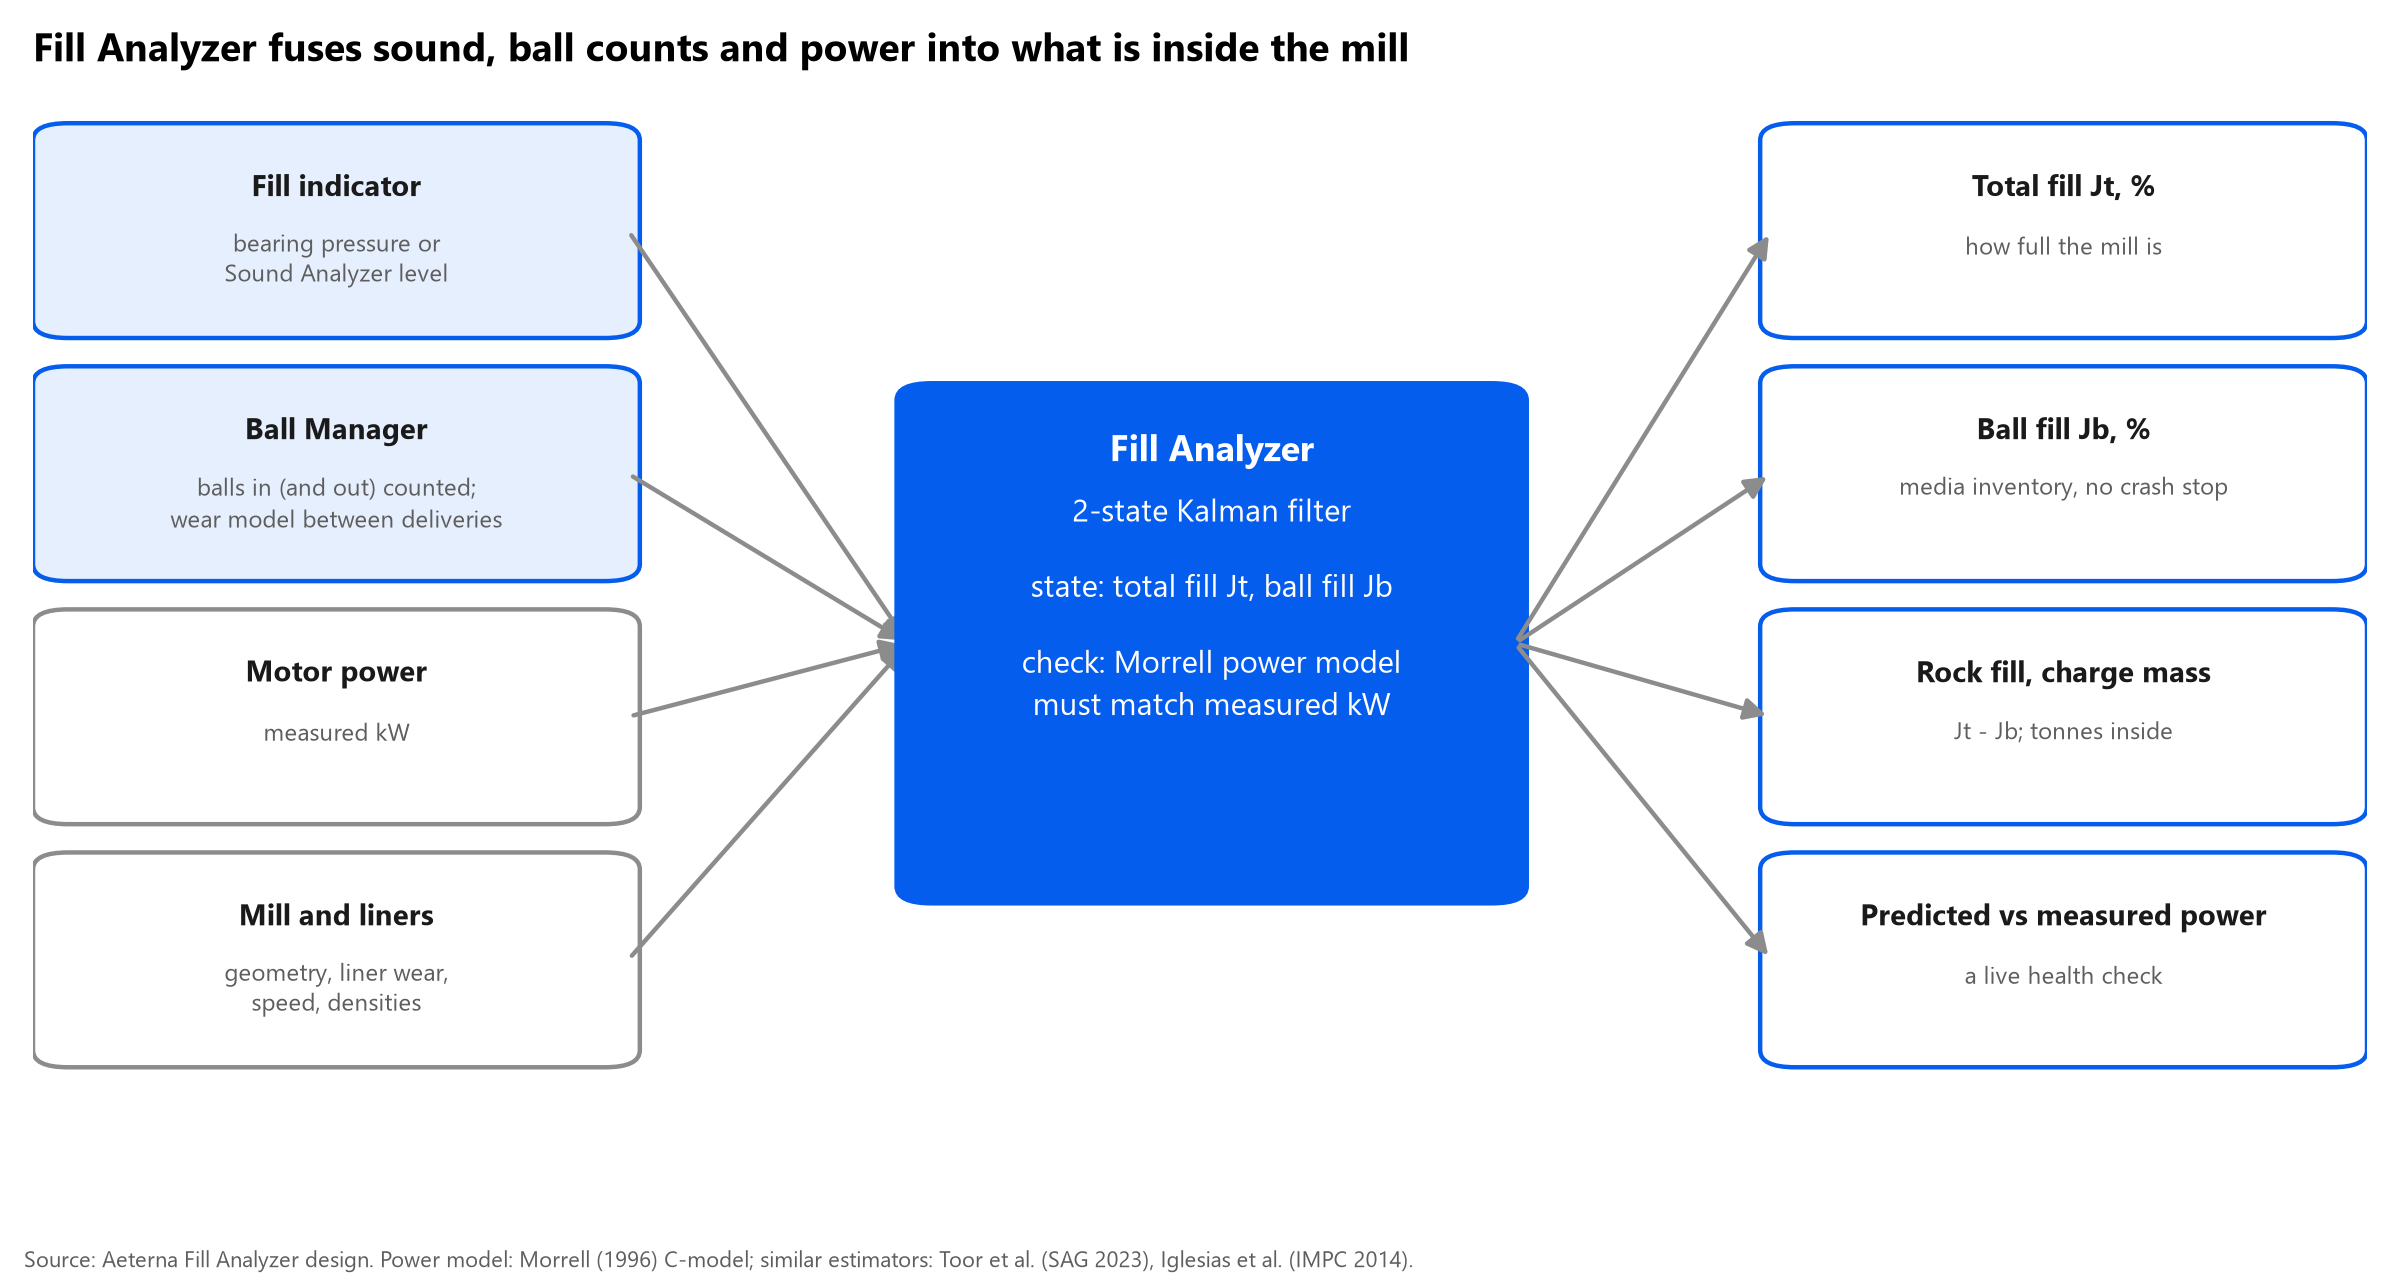
No single signal measures both total fill and ball fill. The Fill Analyzer combines several. A fill indicator - bearing pressure or the Sound Analyzer level, calibrated by regression - gives a first estimate of Jt. Ball Counter's counts, less a wear model between deliveries, give a first estimate of Jb. The Morrell power model then predicts the power those two fillings should draw for the mill's geometry, speed, liner wear and densities.
A two-state extended Kalman filter compares predicted with measured power each cycle and corrects Jt and Jb. Engineers can choose which estimate to trust when they disagree (for example, trust the ball counter and let total fill absorb the correction), and calibrate against crash stops, grind-outs and liner scans when they happen. Outputs include Jt, Jb, rock fill (Jt - Jb), charge mass and predicted versus measured power - a continuous health check on the whole estimate.
This is the same family of method described in the literature: Kalman filters with a power model (Herbst, 1990; IFAC 2008 comparison favouring the extended Kalman filter) and Morrell-based Jb/Jt estimation (Iglesias, 2014; Toor et al., 2023).
Ball Counter: the ball-fill half of the picture
Ball charge is usually measured by a crash stop followed by a grind-out: the mill is stopped with feed cut, then run without ore for 10-20 minutes so balls can be measured. It is accurate and it costs production every time. SAG mills typically carry 8-21 % ball charge, and the right level moves with ore and liners.
Ball Counter uses a camera and an instance-segmentation network to count balls as they pass, classifying each as whole or split. Split fraction is an early sign of media degradation, and a normalised count turns fragments into whole-ball equivalents. Counting balls in (and, where fitted, out) gives the Fill Analyzer a live Jb prior between grind-outs.
Media condition has a measurable effect: at Navachab, removing 30 t of worn scats raised throughput by about 11 % (Powell & Smit). Knowing the ball charge continuously lets the plant act before the next shutdown.
Signals compared
| Signal | What it measures | How fast it responds | Main weakness | Aeterna instrument |
|---|---|---|---|---|
| Bearing pressure / load cells | Total mass on the bearings (charge + liners + shell) | Minutes | Noisy, drifts with temperature; liner wear shifts the zero | Input to Fill Analyzer |
| Motor power | Torque needed to lift the charge | Minutes | Same kW on both sides of the power peak, so it cannot tell under- from over-filled | Cross-check inside Fill Analyzer |
| Sound level | Energy of impacts on the shell | Seconds | Needs care with mic position, background noise and calibration | Sound Analyzer |
| Impact rhythm (envelope spectrum) | Whether media lifts and lands once per lifter pass | Seconds | Interpretation is site-specific; needs mill speed and lifter count | Sound Analyzer |
| Fill and charge angles | Total fill Jt, ball fill Jb, toe / impact position | Seconds to minutes | Model needs geometry, liner wear and periodic calibration | Fill Analyzer |
| Ball additions and condition | Balls in (and out), split fraction, size | Continuous | Camera view must be kept clean | Ball Counter |
| Crash stop + grind-out | Direct measure of Jt and Jb | A few times a year | Lost production at every measurement | Used to calibrate |
How it fits with control
The three instruments do not replace bearing pressure or power; they add the fast and the missing signals. With Jt and impact position measured continuously, the MPC can hold the load closer to its productive limit and trim speed to keep media landing on the toe as liners wear. See the companion pack R-038 (SAG APC) for how sound, bearing pressure and power are used together as constraints.
Common misconceptions
- 'Loud means overloaded.' Usually the opposite: a ringing mill is often under-filled with balls hitting bare shell; overload muffles the sound.
- 'Sound can replace bearing pressure.' Single microphones are better alarms than controllers; the value comes from fusing sound with load and power.
- 'Ball charge only needs checking at shutdowns.' Media wear and splitting change the charge every day; a continuous count closes the gap between grind-outs.
- 'Power tells you how full the mill is.' Power peaks at an intermediate filling, so on its own it cannot tell which side of the peak the mill is on.
Uncertainties and limits
- Published papers on acoustic SAG control (Pax, La Rosa) give qualitative results in their abstracts; quantitative accuracy comparisons sit behind paywalls and were not verified here.
- Microphone placement, neighbouring equipment noise and calibration drift affect sound level; site commissioning and periodic calibration are part of the product, not an extra.
- Fill Analyzer accuracy depends on geometry, liner wear model and calibration points; published Jb estimators range from 79 % to 96 % accuracy across mills.
- Aeterna's published outcome range (+1-3 % throughput, 3-8 % lower kWh/t) refers to the full MPC plus instruments, and the site lists case figures as sample numbers - treat them as targets until a site case is published.
Curious how full your SAG mill really is between grind-outs? Ask us about a Fill Analyzer trial.
Talk to an engineerSources
- Implementation of acoustic arrays for semi-autogenous grinding mill operation, Pax, Wynn, Mann, Cornish - 12th Mill Operators' Conference (AusIMM), 2014
- A novel measurement for the internal operation of a SAG mill using acoustic sensors - a case study, MetPlant 2015 (AusIMM), 2015
- Understanding size effects of SAG mill operation (MMG Century), Pax & Cornish - 13th Mill Operators' Conference (AusIMM), 2016
- The use of acoustics to improve load estimation in the Cannington AG mill, La Rosa, Cantarutti, Wortley, Ozkocak - MetPlant 2008, 2008
- Electronic ear in SAG mill (practitioner forum), control.com
- On-line sensors for measuring the total ball and charge level in tumbling mills, University of Cape Town (thesis)
- MillSlicer: SAG mill, Molycop
- Impact angle control of a 32 ft SAG mill (IMPC 2024 proceedings), XXXI IMPC 2024 (SME), 2024
- Real-time estimation of SAG mill charge characteristics for process optimization, Toor, Valery, Morrell, Duffy (Hatch) - SAG 2023, 2023
- Development of a dynamic Jb/Jc estimation model in a single stage SAG mill, Iglesias et al. - IMPC 2014, 2014
- Continuous measurement and control of charge volume in tumbling mills, Herbst et al. - SME, 1990
- State estimation for a SAG mill (EKF vs particle filter vs MHE), IFAC World Congress 2008, 2008
- Online ball level estimation using a power model, Universidad de Concepcion (thesis), 2024
- Online SAG mill pulse measurement and optimization (crash-stop and grind-out practice), US DOE (EERE) project report
- Startling effect of ball scats removal on SAG mill performance, M. Powell (UCT) & I. Smit (AngloGold)
- System for monitoring mechanical waves from a moving machine (patent), US Patent 6,874,364
- Fill Analyzer; Ball Counter (product pages), Aeterna Automation, 2026
- Smart Instruments (BallManager), Aeterna Automation, 2026