
Reading the Grade-Recovery Curve for Rougher Performance
Kinetic tests, mass pull, liberation limits and how to compare the plant with the lab
What the curve is, and what it is not
A grade-recovery curve plots cumulative concentrate grade against cumulative recovery of the valuable metal. In a rougher it is built either from timed concentrates in a lab kinetic test or from cumulative cell-by-cell concentrates in a plant survey. Each point is one possible operating point.
The curve is a property of the ore, the grind and the chemistry, tested in a particular machine. Operating variables such as froth depth and air rate mainly choose where on the curve the bank operates; they rarely change the curve's shape. This distinction - moving along the curve versus moving the curve - is the most useful idea in flotation diagnostics.
Because feed grade varies, comparisons across days or ores are cleaner in enrichment ratio (concentrate grade divided by feed grade) than in raw grade (Gerson and Napier-Munn, 2013).
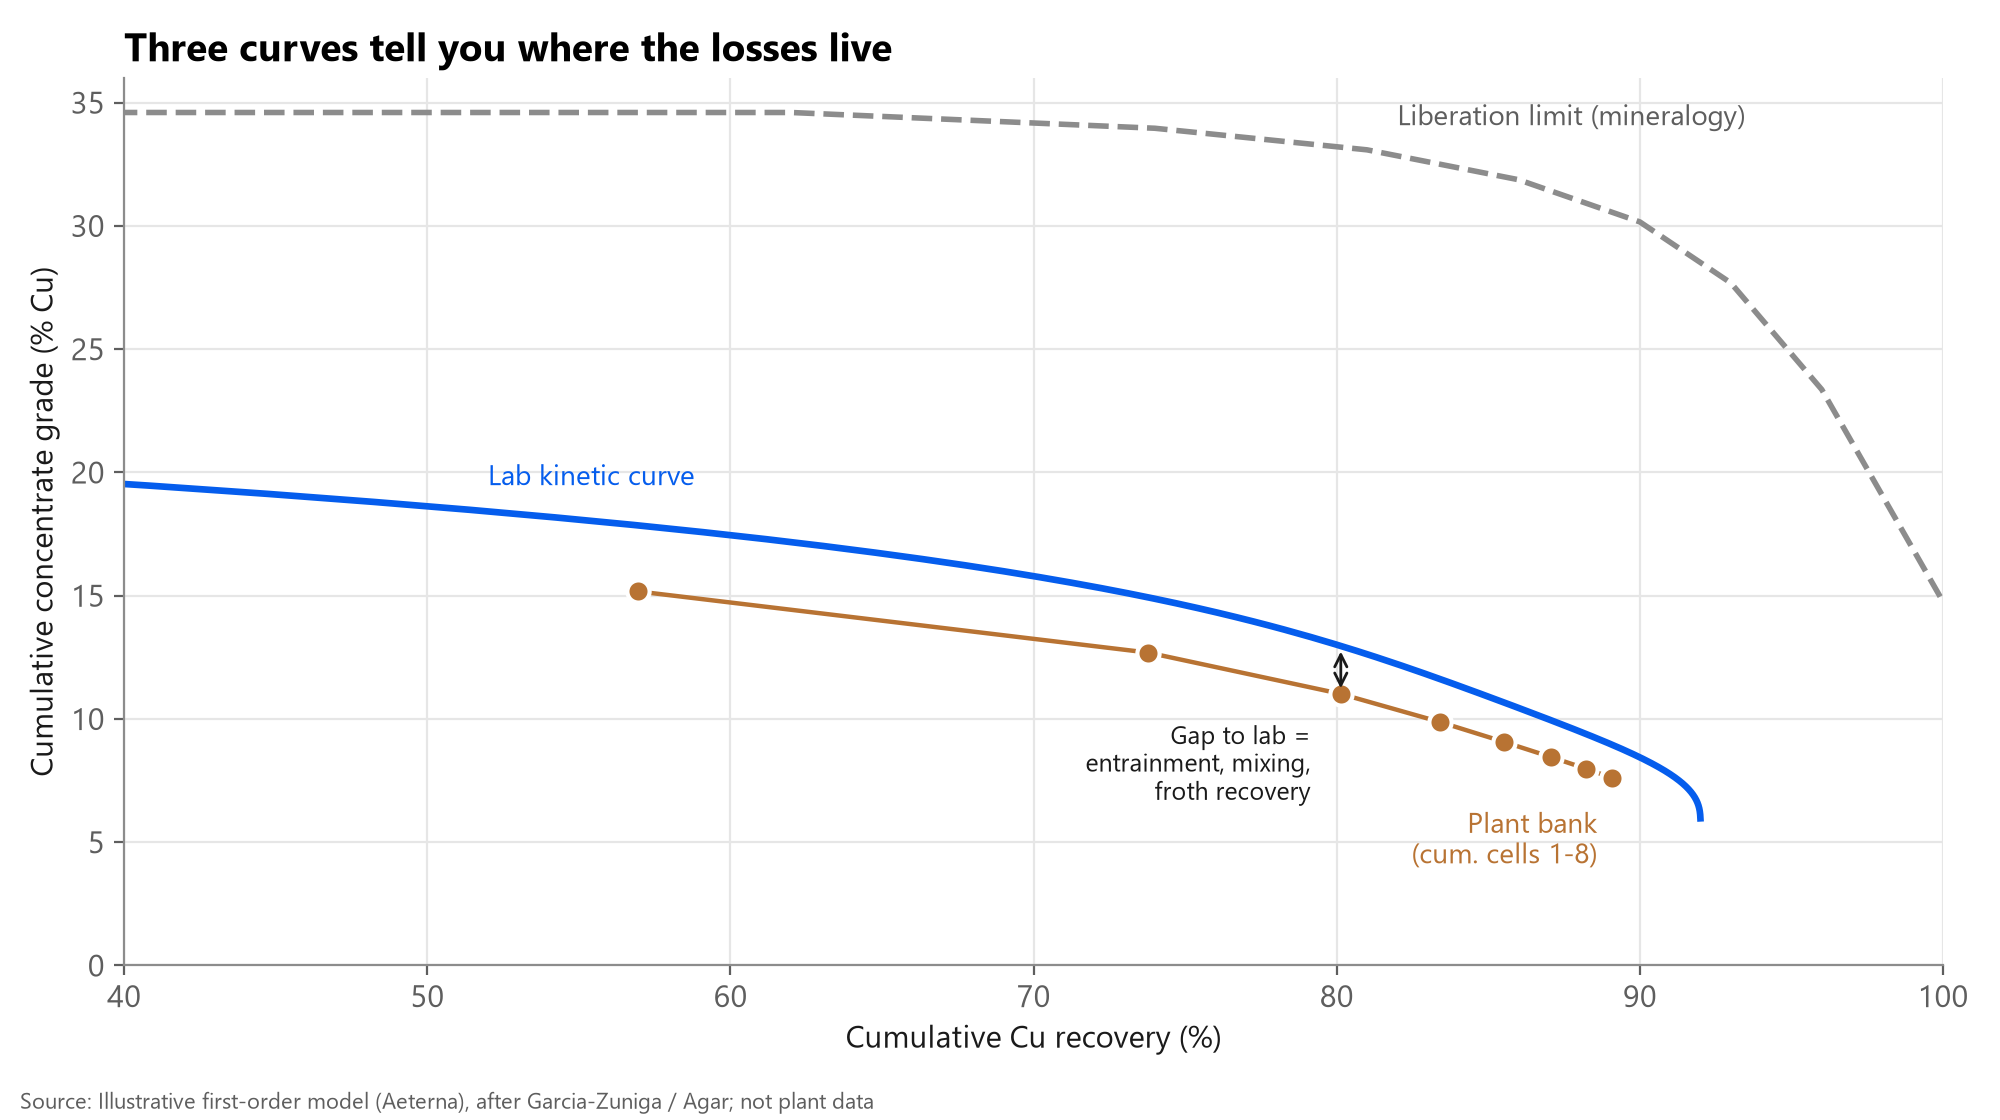
Three curves: liberation limit, lab and plant
The mineralogical, or liberation-limited, curve is built by ranking particles from automated mineralogy (QEMSCAN or MLA) by grade and adding them to a notional concentrate in that order. It is the best separation physically possible at that grind; real flotation falls short because of entrainment and the probabilistic nature of bubble-particle collection (Runge et al., IMPC 2024).
The lab kinetic curve shows what the chosen chemistry achieves in a near-ideal cell. The lab Agitair-type cell is generally regarded as the best hydrodynamic and froth-recovery condition available in conventional flotation, so a well-run plant approaches it rather than beats it.
The plant curve from a bank survey usually sits below the lab curve. The gap between lab and plant points to entrainment, mixing and short-circuiting, and froth drop-back. The gap between liberation and lab points to chemistry or slimes. A lab curve that hugs the liberation limit says grind is the constraint.
- Liberation to lab gap: reagents, pH, slimes, surface oxidation.
- Lab to plant gap: hydrodynamics, froth recovery, entrainment, residence time.
- Lab curve near liberation limit: grind (primary or regrind) is the lever.
Getting a kinetic curve worth trusting
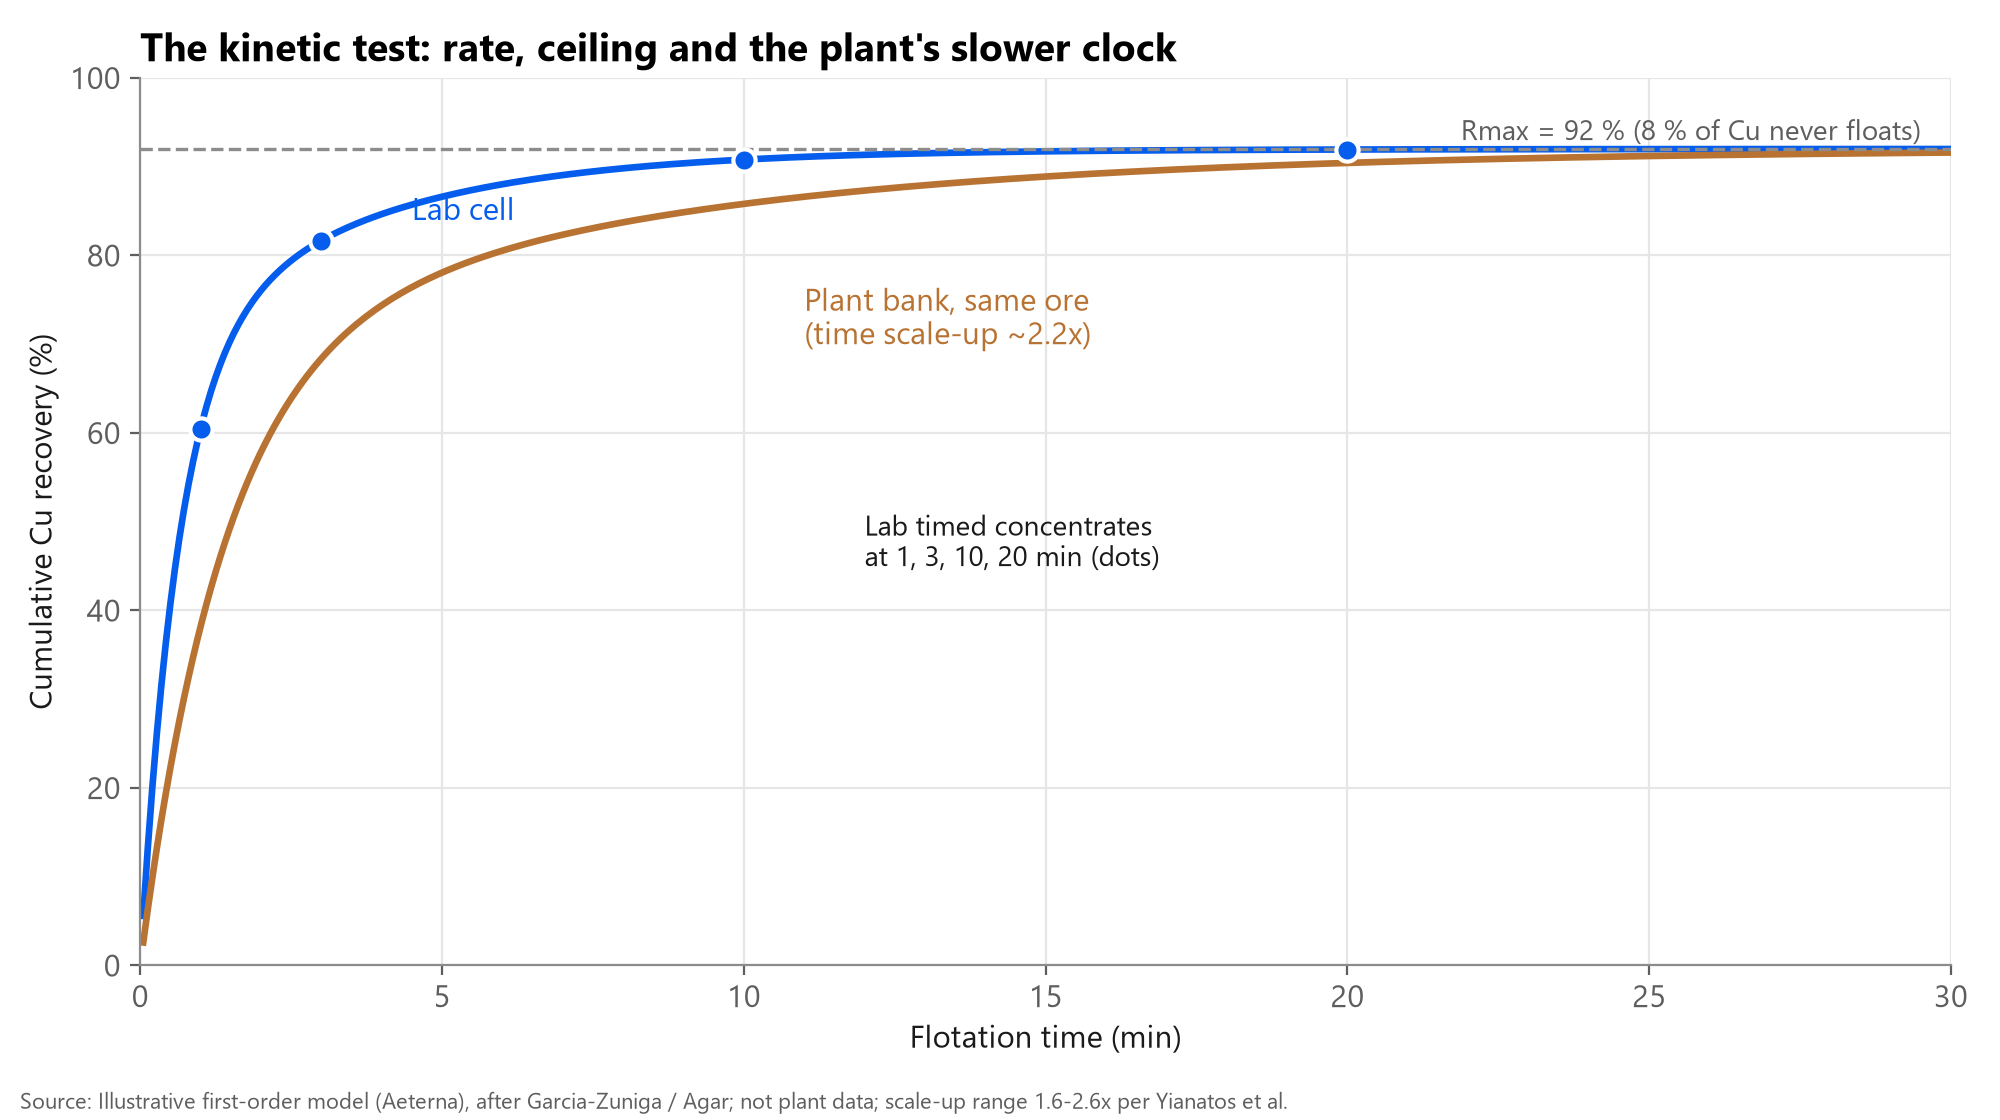
The standard rougher kinetic test floats a representative plant-feed sample at plant density and reagent scheme, collecting concentrates at increasing time intervals. At least four concentrates are needed to describe the recovery-time curve, for example at 1, 3, 10 and 20 minutes, and the test should run until the froth is barren so the curve flattens.
Fitting the first-order model R(t) = Rmax(1 - e^-kt) gives two numbers: k, the rate, and Rmax, the ceiling. Real ores contain fast- and slow-floating fractions, so a two-component or distributed-rate model (for example Klimpel) often fits better. Rate constants depend on test conditions, so keep scraping rate, froth depth, air and impeller speed constant between tests.
Replicates matter. Napier-Munn (2012) showed with bootstrap methods that curves believed to be different are often not statistically different, especially at long times and high recoveries.
Mass pull and where to stop
Every extra percent of mass pull buys recovery at a falling price in grade. In the illustrative model, the first minute recovers about 60 % of the copper at 17 % Cu; by 10 minutes recovery reaches about 91 % at 8 % Cu and 9 % mass pull; another 10 minutes adds 1 point of recovery while mass pull rises to 11 %.
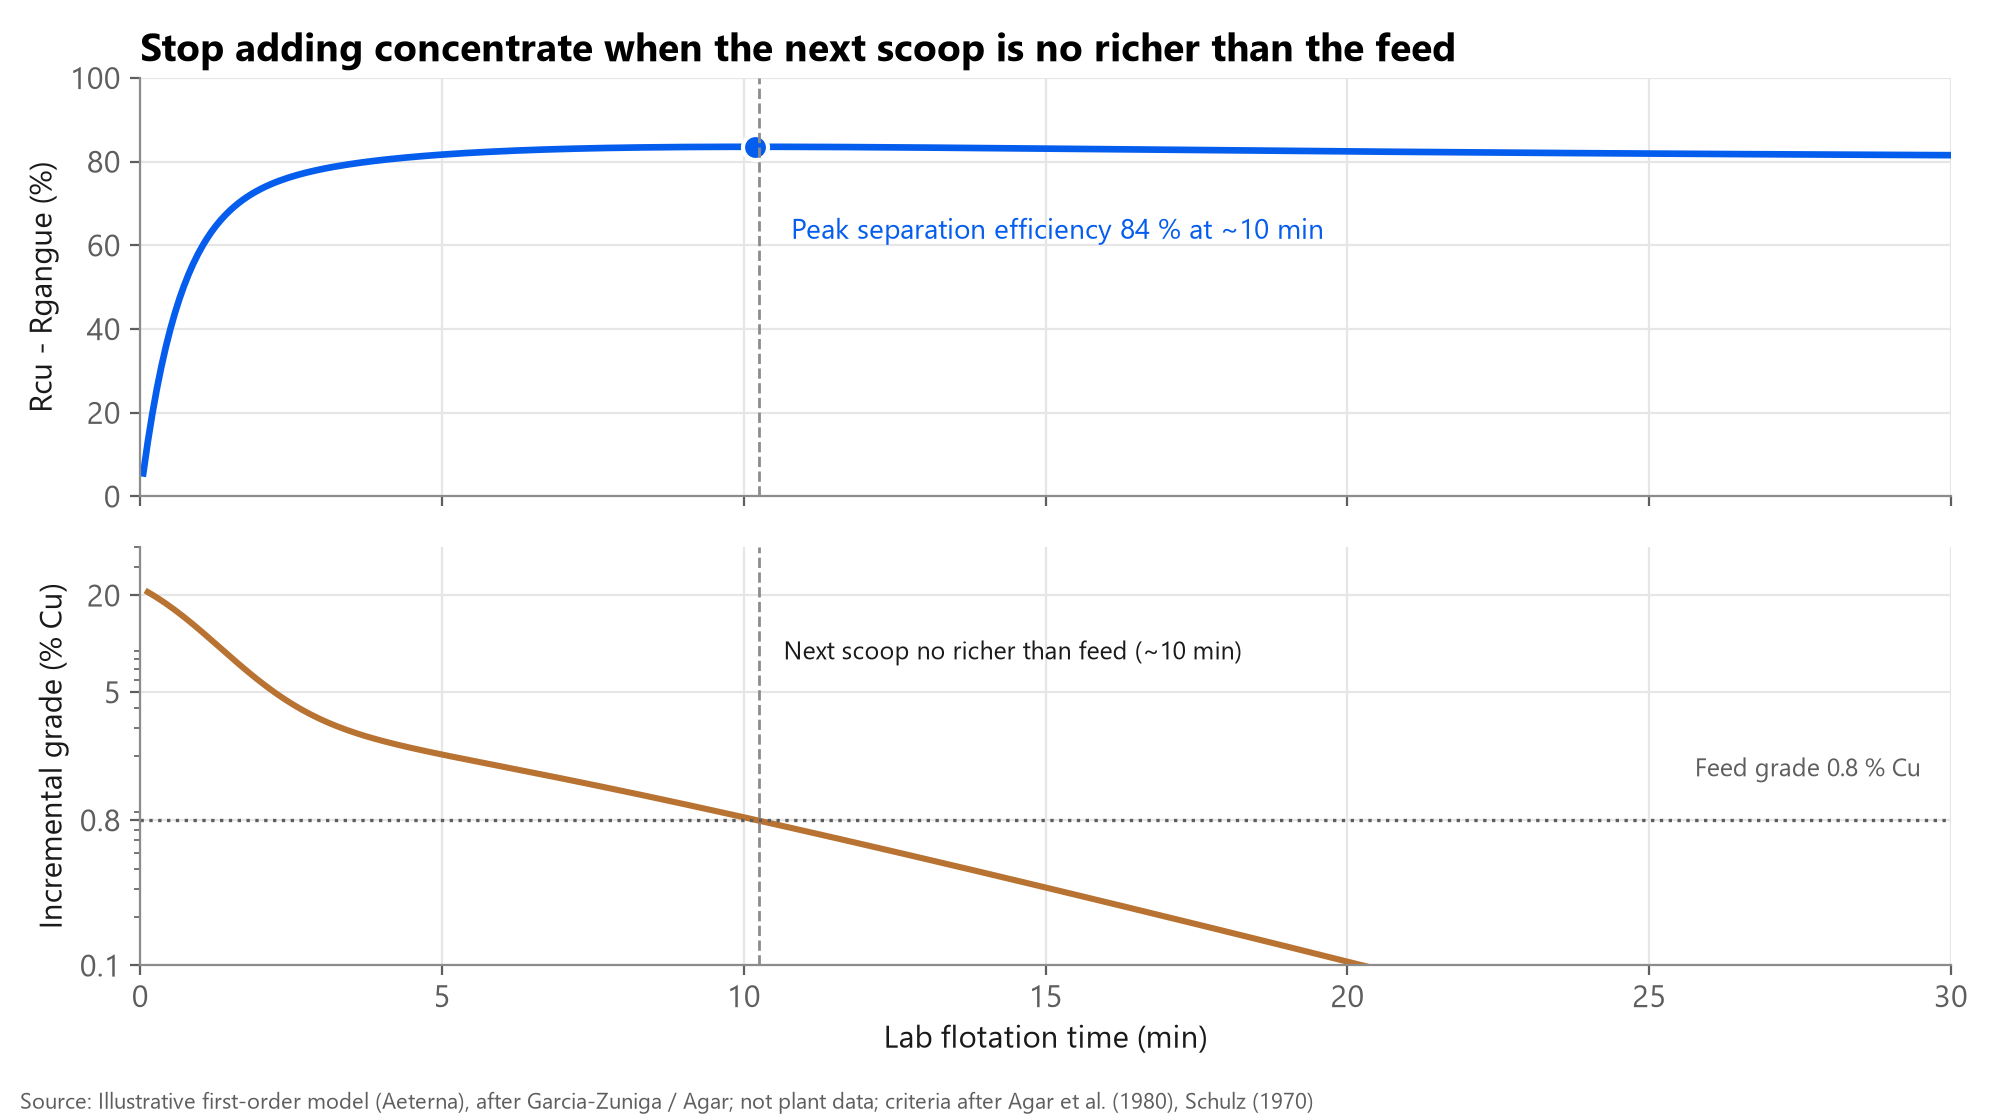
Agar and co-workers formalised the stop rule: keep adding concentrate while its incremental grade is above the feed grade. That point coincides with peak separation efficiency (Schulz, 1970), defined as recovery of valuable minus recovery of gangue. In a rougher feeding a scavenger or cleaner circuit, the rule is applied to the whole circuit design, not to one bank in isolation.
Comparing plant data with lab curves
A fair comparison needs the plant and lab on the same clock and the same grade basis. Survey the bank (feed, each cell or group concentrate, tailings), mass-balance the data, convert plant residence time to an equivalent lab time with a scale-up factor, and plot both curves in enrichment ratio.
Yianatos and co-workers decomposed the lab-to-plant time scale-up into mixing (residence time distribution), solids segregation and froth recovery; for large mechanical cells the factor is typically 1.6-2.6x, with froth transport accounting for about half. Practitioner rules of thumb for copper sit around 2.1x, with larger factors when small lab cells are used (911Metallurgist, informal).
Plant and pilot cells can recover similar mass but very different water: at Toromocho, pilot cells recovered about 30 % water against about 15 % in the 130 m3 plant cells at similar ~10 % mass recovery, and the plant recovered less very fine copper (IMPC 2024). Water recovery is therefore worth logging in every survey.
| What you see | Likely cause | First check |
|---|---|---|
| Plant point on the lab curve, low recovery | Not enough mass pull or residence time | Froth velocity, level and air profile; bank residence time vs scaled lab time |
| Plant point below the lab curve | Entrainment, short-circuiting, froth drop-back | Water recovery, -20 um gangue, cell mixing and froth depth |
| Lab curve far below liberation limit | Chemistry: collector, pH, slimes, oxidation | Reagent scheme tests; surface analysis |
| Lab curve close to liberation limit | Grind is the constraint | P80 and liberation by size; regrind or primary grind tests |
| Curve moves day to day | Ore variability or feed-grade swings | Plot enrichment ratio; tag tests by ore type |
| Two curves 'look' different | Test noise | Replicates and bootstrap confidence intervals |
Entrainment: when more mass pull buys dilution
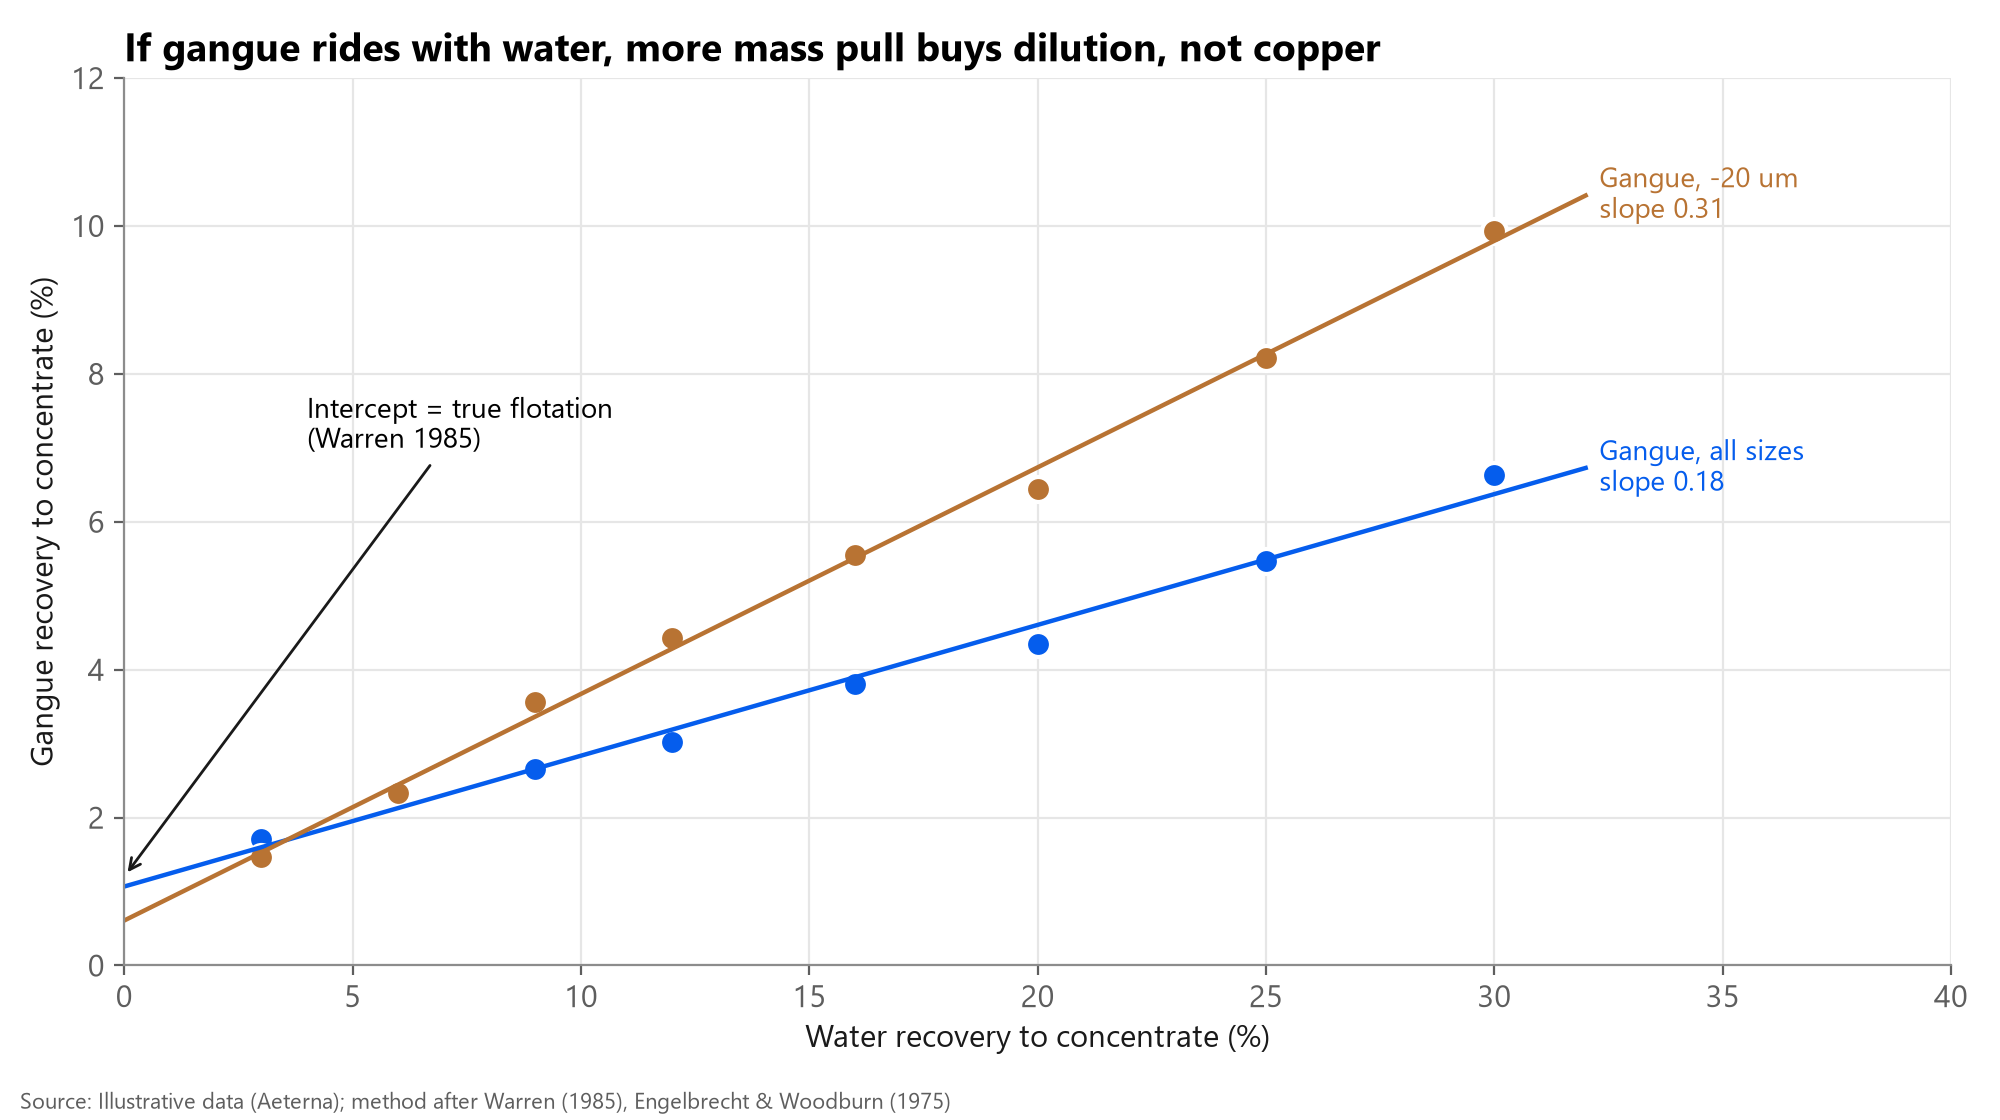
Gangue recovery often tracks water recovery almost linearly, especially for fine particles (Engelbrecht and Woodburn, 1975; Lynch et al., 1981). Warren (1985) separated true flotation from entrainment by extrapolating the gangue-water line to zero water recovery: the intercept is true flotation, the slope is entrainment.
A steep slope for the -20 um fraction tells you that pushing mass pull with shallower froth or more air mainly brings water and fine gangue. In that case froth depth, wash water (in columns) or a cleaner stage are better routes to grade than chemistry changes.
Key numbers and rules of thumb
| Item | Typical value / rule | Source |
|---|---|---|
| First-order kinetic model | R(t) = Rmax (1 - e^(-k t)); k and Rmax are the two numbers that describe floatability | Garcia-Zuniga (1935); Wills & Finch (2016) |
| Minimum timed concentrates | 4 concentrates, e.g. 1, 3, 10, 20 min; run until the froth is barren and the curve flattens | Eurus procedure; Molycop lab testing |
| Optimum flotation time | Stop where incremental concentrate grade = feed grade (peak separation efficiency) | Agar et al. (1980); Schulz (1970) |
| Separation efficiency | SE = R(valuable) - R(gangue); a single number for comparing tests with different grades | Schulz (1970) |
| Lab-to-plant time scale-up | 1.6-2.6x when residence time comes from lab batch tests | Yianatos et al. (2010, 2015) |
| Copper rule-of-thumb scale-up | ~2.1x Cu, ~2.6x Mo (book value); larger factors for small lab cells | 911Metallurgist (informal) |
| Share of scale-up from froth | Froth transport ~50% of the total scale-up factor | Yianatos et al. |
| Plant vs pilot water recovery | Pilot ~30% vs plant ~15% water recovery at similar ~10% mass recovery (Toromocho) | IMPC 2024 |
| Grade normalisation | Use enrichment ratio (concentrate grade / feed grade) when feed grade varies | Gerson & Napier-Munn (2013) |
| Low-liberation particles | Particles < 50% liberated had a significant effect on rougher recovery (Collahuasi) | Minerals 13(5) 621 (2023) |
Instrumentation and APC angle
The grade-recovery curve tells the metallurgist which operating point is worth having; keeping the bank there through ore changes is a control problem. Froth cameras measure froth velocity and bubble size within seconds and act as fast indicators of mass pull, while on-stream analysers confirm grade on a 10-30 minute cycle.
A layered strategy - stable level and air loops, froth-velocity or mass-pull targets, then analyser-based grade-recovery trim - lets the controller hold the chosen point on the curve. It does not move the curve; liberation and chemistry do that. See the Aeterna R-033 research pack on flotation APC and the published posts 'The froth knows first' and the bubble-size literature review for the control detail.
Aeterna tie-in (light, as this is a process-knowledge piece): the Froth Analyzer gives the controller a head start on mass pull, and MPC holds the operating point the metallurgist chooses from the curve.
Common misconceptions
- 'The plant should match the lab.' A well-run plant approaches the lab curve at scaled time; it rarely meets it, because lab cells have near-ideal mixing and froth recovery.
- 'More air or shallower froth always means more recovery.' It means more mass pull; if the extra mass is entrained water and fines, grade falls with little copper gained.
- 'A higher point on the chart is a better test.' Only if it is higher at the same recovery and the difference is larger than replicate noise.
- 'Comparing raw grades across days is fine.' Feed grade swings shift the curve; use enrichment ratio.
- 'Rmax is 100 %.' Most ores have a non-floating fraction (locked, oxidised or slimed particles); fitting Rmax reveals it.
Where sources disagree or are uncertain
- Scale-up factors vary widely: 1.6-2.6x (Yianatos, large mechanical cells) versus 2.5-4x informal rules for small lab cells; column cells much higher. The factor is site- and cell-specific.
- Lab cells as an upper bound: most sources treat the lab cell as near-ideal, but at least one thesis (Ramlall, UKZN) argues single-cell batch tests can distort rate constants and shift the curve.
- The gangue-water relationship is linear in many studies but not at low water recovery, and some authors prefer non-linear multivariable models.
- All curves in this pack's figures are illustrative model output, not plant data; numbers in the text come from the cited sources.
Send us a recent rougher survey and lab kinetic test; we will plot the three curves with you and show where the gap sits.
Talk to an engineerSources
- Wills' Mineral Processing Technology, 8th ed. (flotation kinetics, separation efficiency), Wills & Finch, Butterworth-Heinemann, 2016
- Statistical methods to compare batch flotation grade-recovery curves and rate constants, Napier-Munn, Minerals Engineering 34, 70-77, 2012
- Batch flotation test statistics: enrichment ratio and bootstrap confidence intervals (review, title paraphrased), Gerson & Napier-Munn, Minerals 3(1), 1-15, 2013
- Laboratory flotation testing - an essential tool for ore characterisation, Runge, AusIMM Flotation Plant Optimisation (Spectrum 16), 2010
- Flotation scale-up: correction factors for mixing, segregation and froth recovery (Codelco Norte 160/300 m3), Yianatos et al., Minerals Engineering 23, 877-884, 2010
- Flotation time scale-up factors - laboratory to plant, 911Metallurgist (practitioner blog, informal), n.d.
- Minerals beneficiation - separation efficiency, Schulz, Trans. SME-AIME, 1970
- Optimizing the design of flotation circuits (optimum residence time criteria), Agar et al., CIM Bulletin, 1980
- Liberation-limited grade-recovery curves and real flotation selectivity (MLA galena example), IMPC 2024 Proceedings, SME, 2024
- Using QEMSCAN mineral exposure to predict flotation rougher recovery, OneMine / AusIMM, n.d.
- Rougher bank surveys at Collahuasi (130 and 300 m3 cells, QEMSCAN), Minerals 13(5), 621 (MDPI), 2023
- Plant vs pilot rougher performance at Toromocho; lab Agitair as best-case hydrodynamics, IMPC 2024 Proceedings, SME, 2024
- Entrainment of gangue: gangue-water recovery relationship (Warren 1985; Engelbrecht & Woodburn 1975), University of Cape Town thesis review, n.d.
- Laboratory flotation test procedure: timed concentrates until froth is barren, Molycop - lab testing, n.d.
- Semi-batch flotation and shifts in recovery-grade curves from batch rate constants, Ramlall, University of KwaZulu-Natal thesis, n.d.