
ProcessOpt tutorial: Thickener Model: Settling, Compression and Rake
Configure a Bürger-Diehl thickener model and watch it respond - step by step in ProcessOpt
1 Fundamental
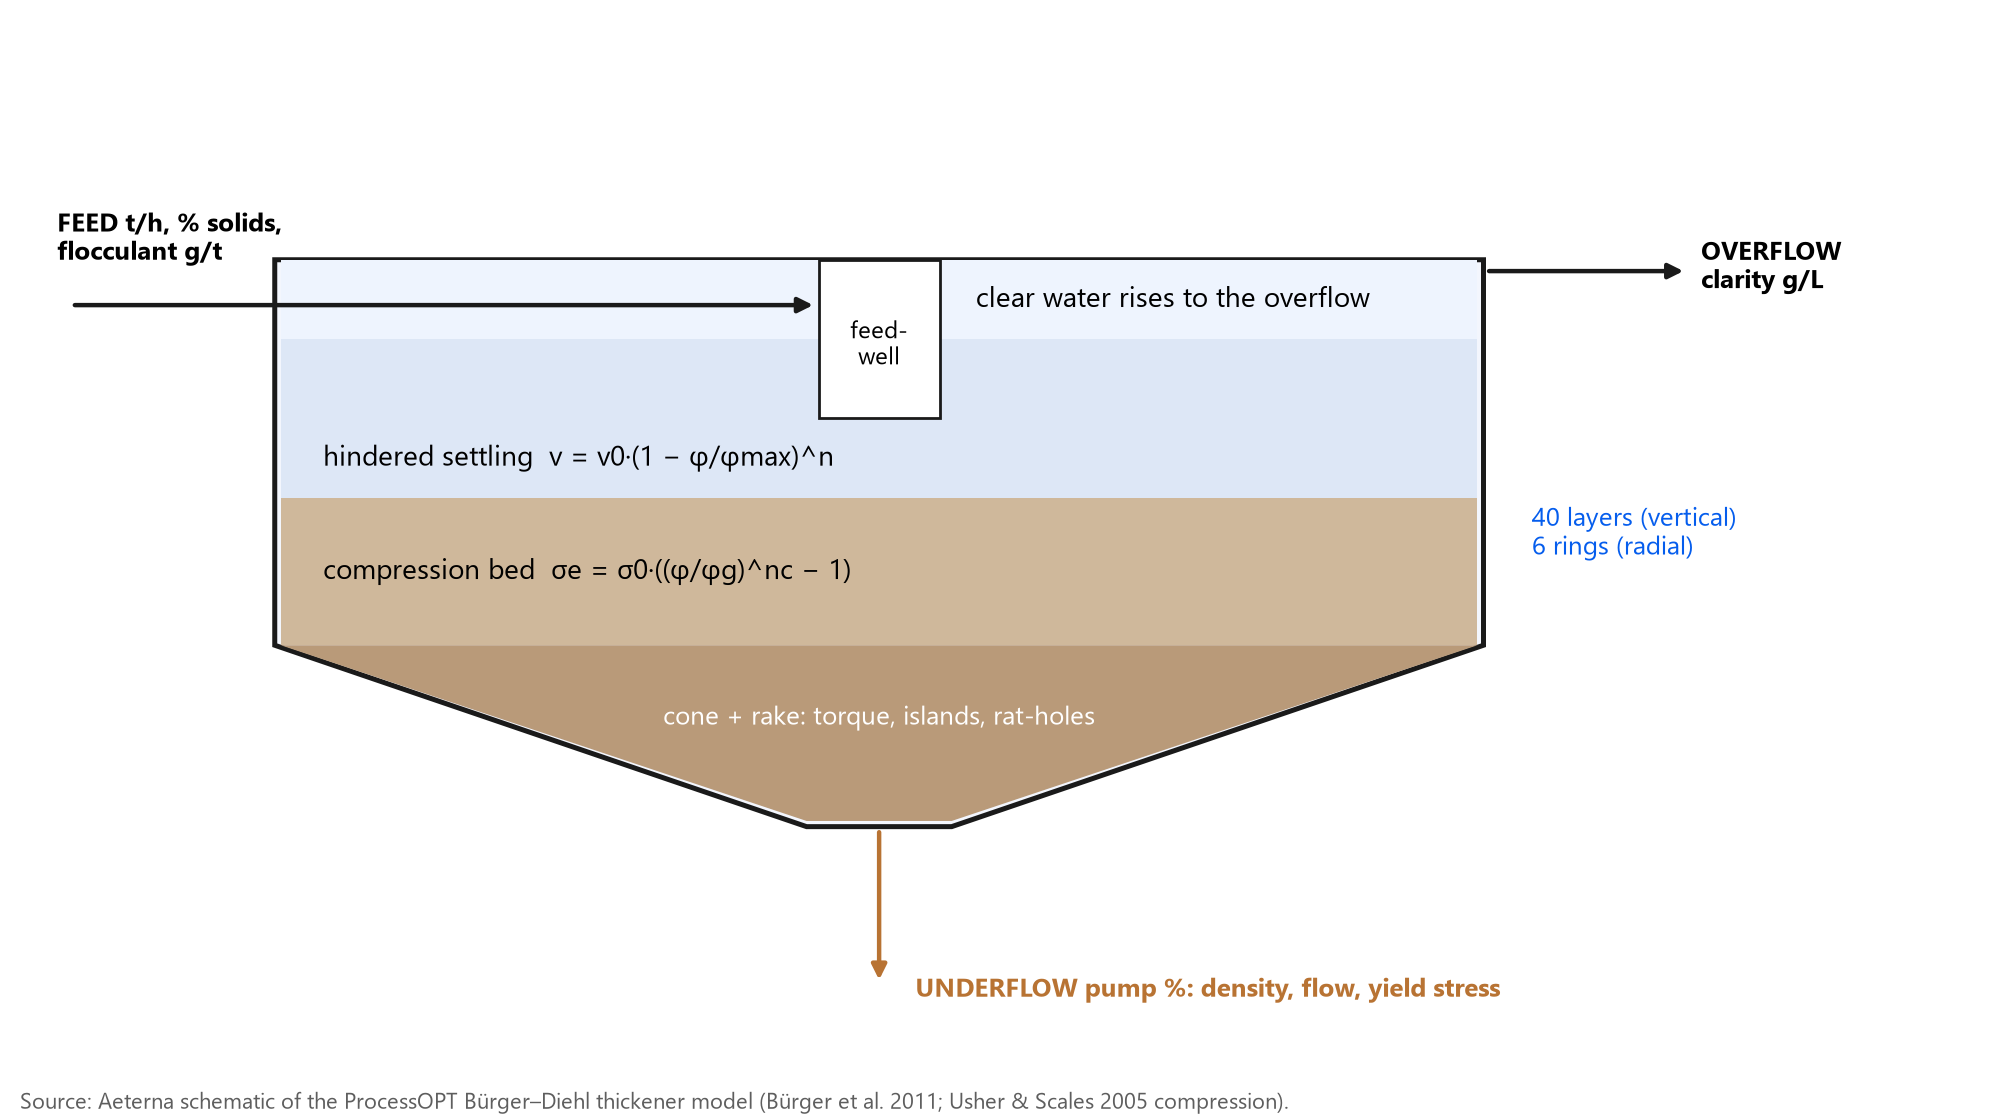
Solids settle, then compress; the rake and pump decide what leaves the cone.
The thickener model settles the slurry layer by layer
Bürger-Diehl: each layer exchanges solids by hindered settling above the gel point and by compression below it. The radial bed model tracks how the rake moves mud to the cone and when islands or rat-holes form.
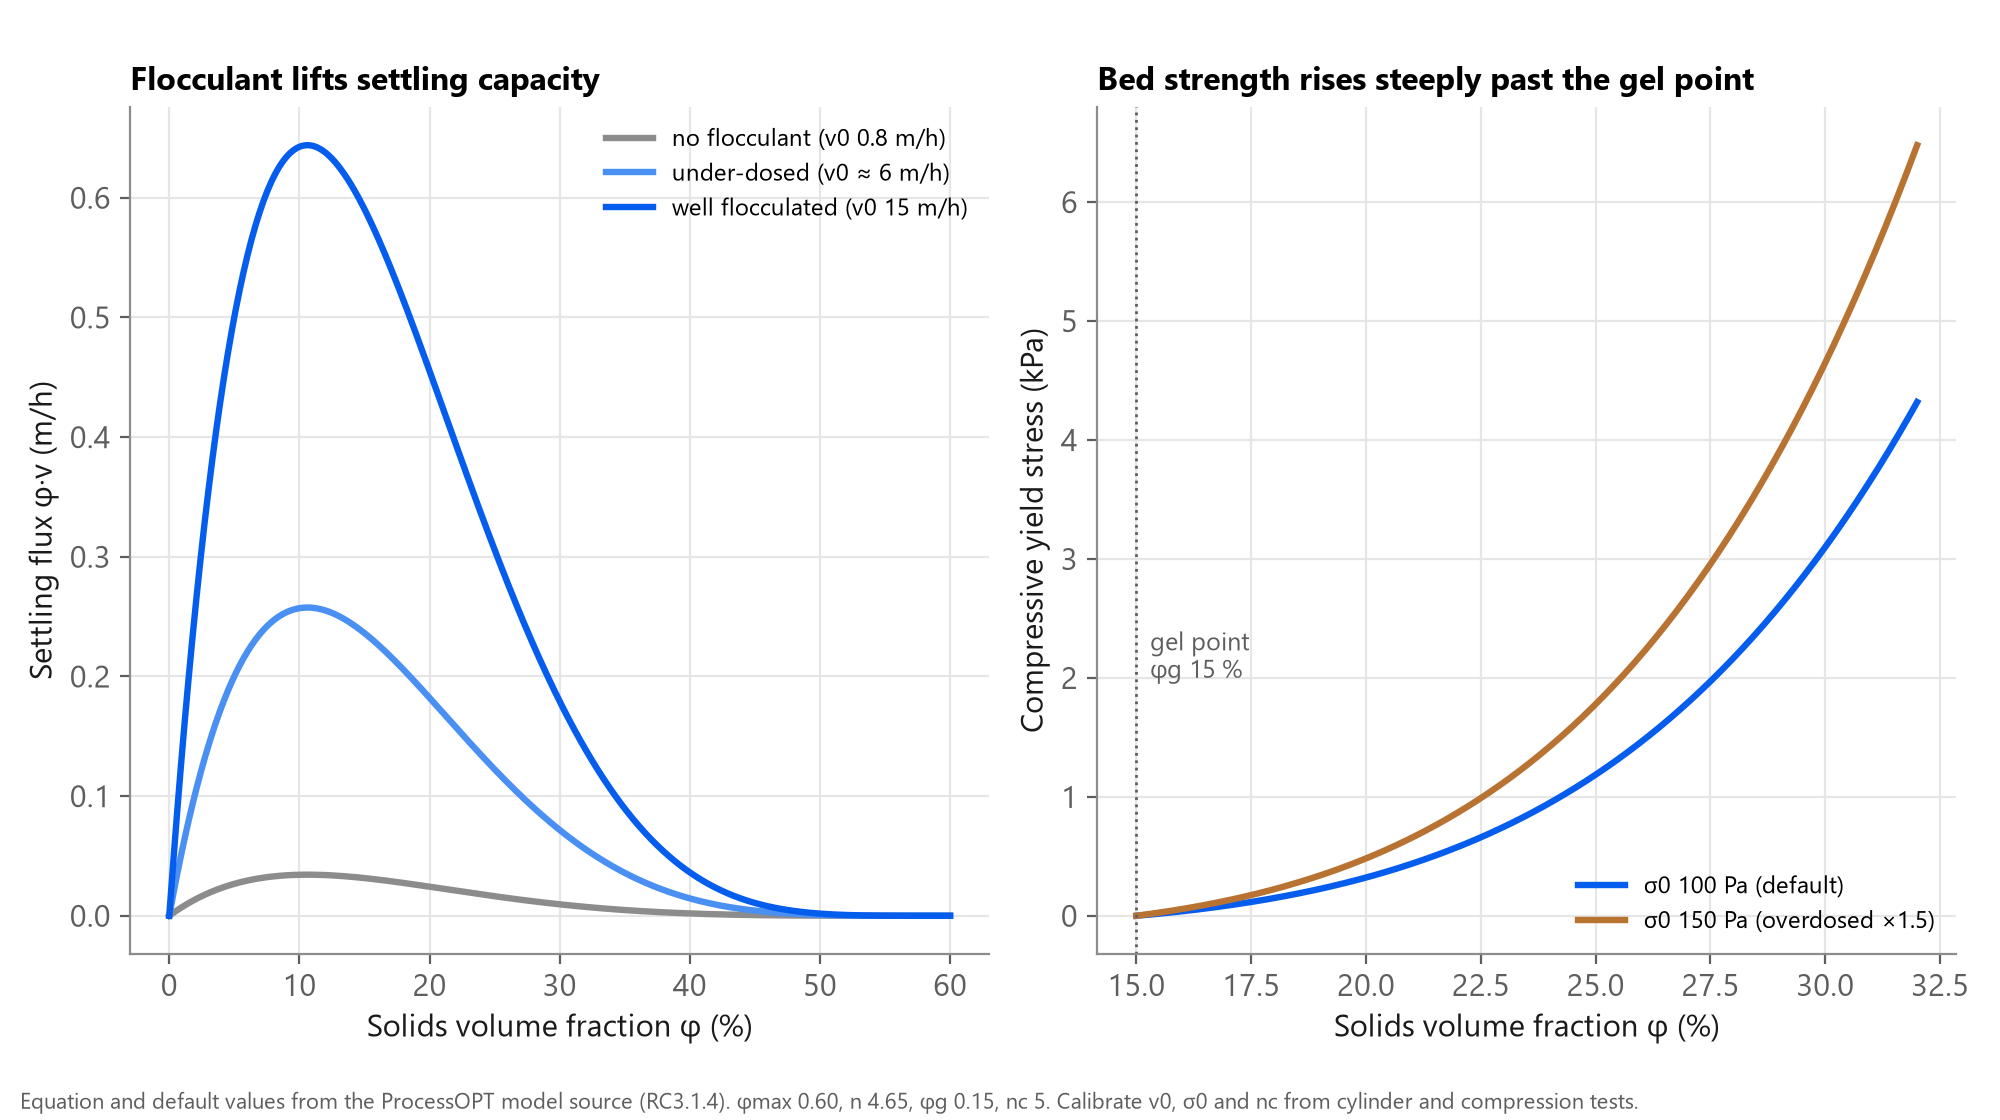
Two material curves set how the thickener behaves
Overdosing raises σ0 and τ0 in the model, which means a stronger bed, higher torque and more plugging risk.
2 Objective
A thickener model that shows bed, underflow density, clarity and rake torque - and how they respond to each lever.
By the end you will have
- A thickener node sized to your tank and drive
- Settling and compression calibrated to your test work
- Underflow density, bed level and mass, overflow clarity and rake torque as live tags
- Bog-risk indicators with the main driver
- A dashboard page with levers to test control strategies safely
3 Step by step
Every screen below is a real ProcessOpt screenshot.
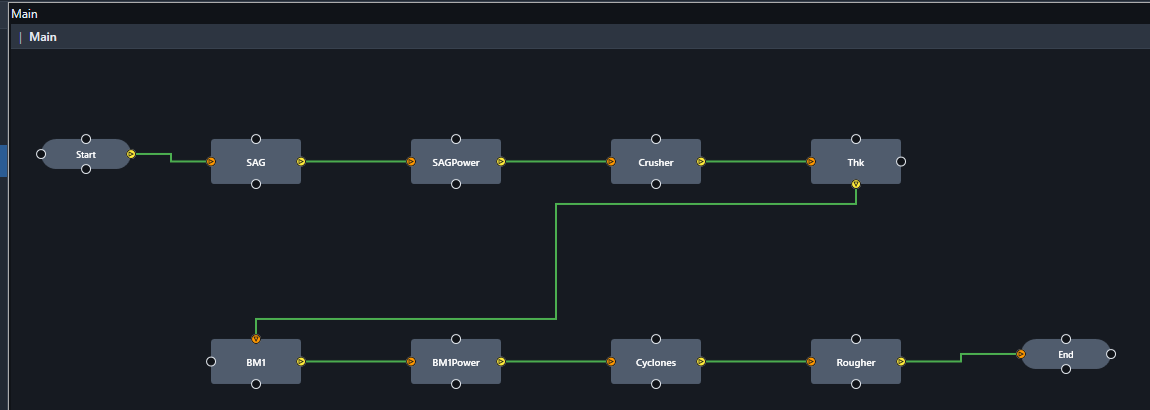
Step 1 - Add a Simulation node and wire it into the scan
Every model in ProcessOpt runs inside a Simulation node. The node is executed once per scan cycle in the order of the graph, so place it after the logic that writes its inputs and before the logic that reads its outputs.
- Project Configuration > Logic Editor
- Right-click the canvas > add a Simulation node, name it Thk
- Connect Start > Thk > End so it runs every scan cycle (1 s here)
- One node per unit: the demo project has eight models on one canvas
Step 2 - Choose the model type and name the I/O tags
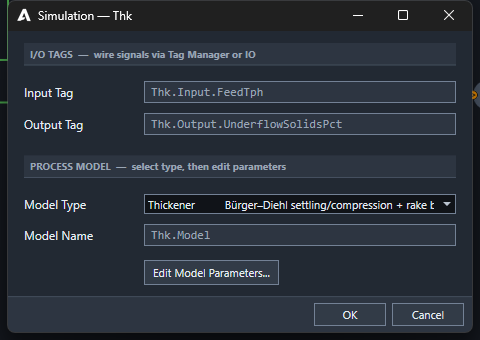
- Double-click the node to open the Simulation dialog
- Model Type: Thickener (Bürger-Diehl settling/compression + rake bogging)
- Input Tag and Output Tag are the two headline signals; every other result gets its own tag automatically
- Press Edit Model Parameters... for the full model sheet
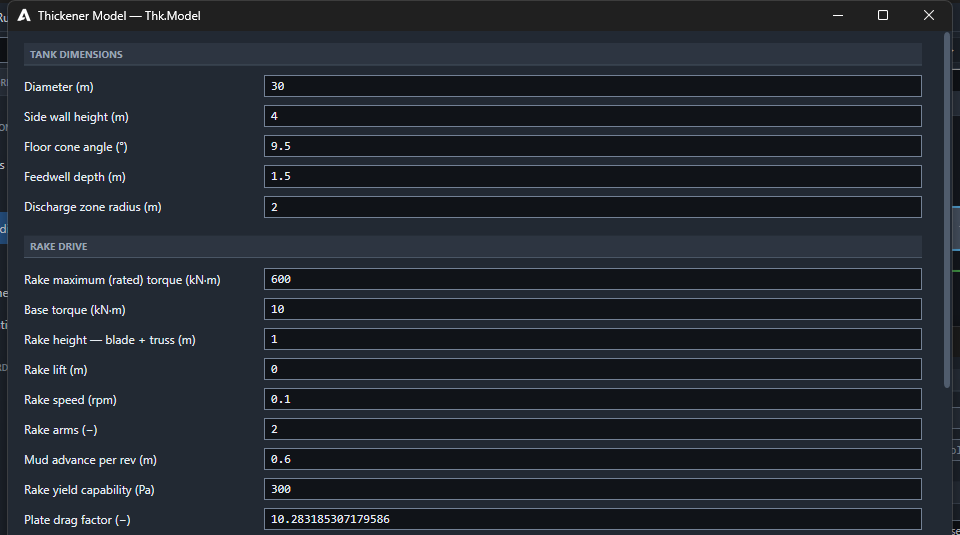
Step 3 - Tank dimensions and rake drive
Take dimensions from the general arrangement drawing. Rated torque comes from the drive nameplate; base torque is the reading with the rakes turning in clear water.
- Diameter 30 m, side wall 4 m, floor cone 9.5°
- Feedwell depth 1.5 m, discharge zone radius 2 m
- Rake: rated torque 600 kN·m, base torque 10 kN·m, 2 arms, 0.1 rpm
- Rake lift 0 m (lowered); rake yield capability 300 Pa
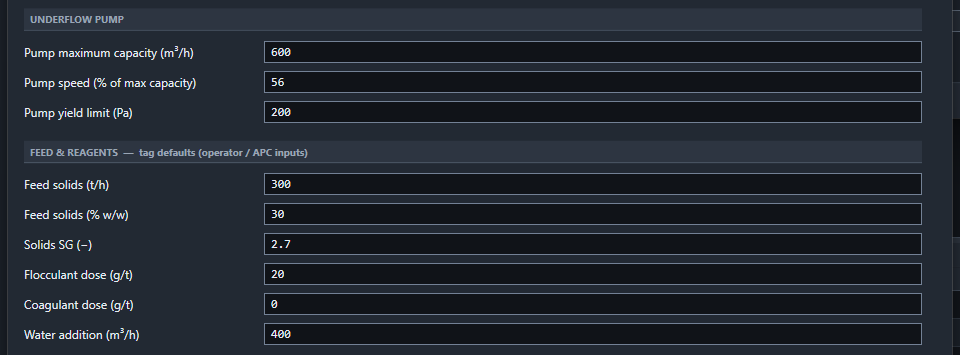
Step 4 - Underflow pump, feed and reagents
- Pump maximum capacity 600 m³/h; speed 56 % (live tag)
- Feed 300 t/h solids at 30 % w/w, solids SG 2.7
- Flocculant 20 g/t, coagulant 0 g/t, dilution water 400 m³/h
- All of these are tag defaults: operators or APC move them live
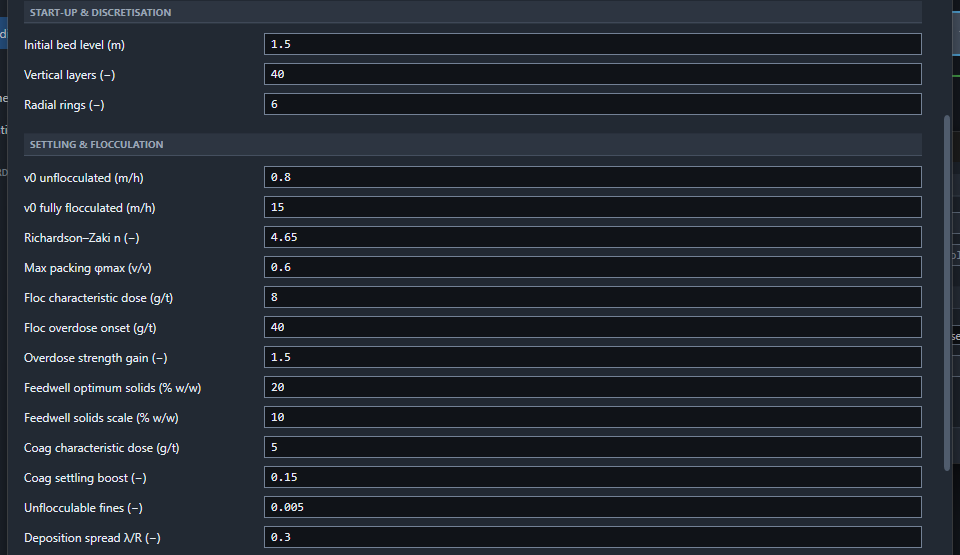
Step 5 - Settling and flocculation: match your cylinder tests
v0 and n are fitted to batch settling tests at a few solids concentrations. The floc characteristic dose is the dose that gives about two-thirds of the full flocculation benefit.
- v0 unflocculated 0.8 m/h, fully flocculated 15 m/h
- Richardson-Zaki n 4.65, max packing 0.6
- Floc characteristic dose 8 g/t; overdose onset 40 g/t
- Feedwell optimum solids 20 % w/w: dilution matters
- Start-up: initial bed 1.5 m, 40 layers, 6 rings
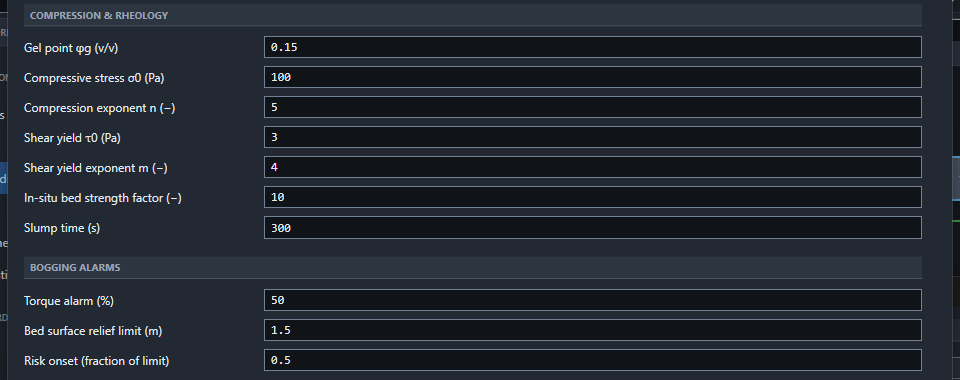
Step 6 - Compression, rheology and bogging alarms
Compression parameters come from pressure-filtration or centrifuge tests. Without test work, start at the defaults and adjust σ0 until the simulated underflow density matches the plant at a known bed level.
- Gel point 0.15 v/v, compressive stress σ0 100 Pa, exponent 5
- Shear yield τ0 3 Pa, exponent 4: drives rake torque
- Torque alarm 50 %, bed relief limit 1.5 m
- The model reports a bog-risk % and its main driver
Step 7 - Know the outputs before you build the page
- Underflow: density (SG and % w/w), flow, solids t/h, yield stress
- Bed: level, mass, floor pressure, inventory
- Rake: torque kN·m and %; overflow clarity g/L
- Bogging: rat-hole and island indices, bog risk %
- Profiles: solids % per layer for a live bed chart
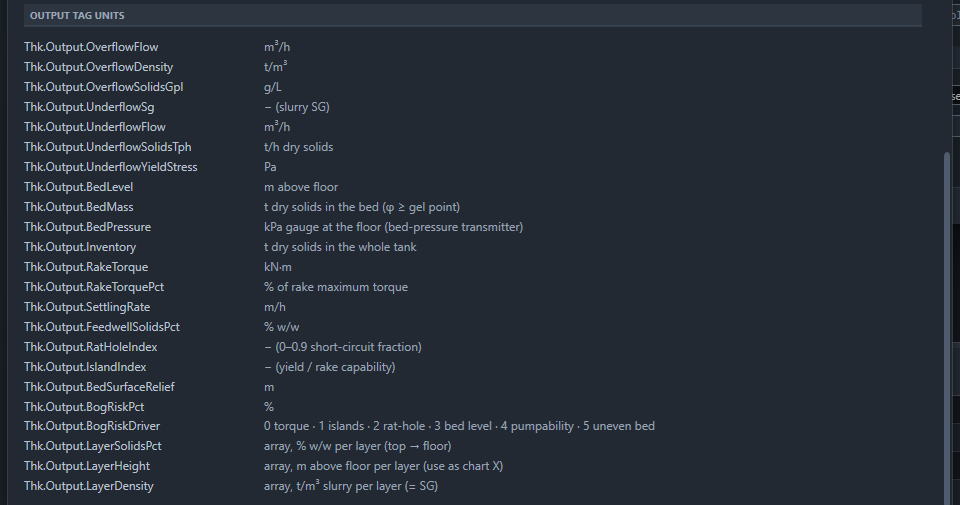
Step 8 - Run it: put levers and readouts on a dashboard page
The tutorial project runs the thickener at 30× speed so that hours of thickener time pass in minutes.
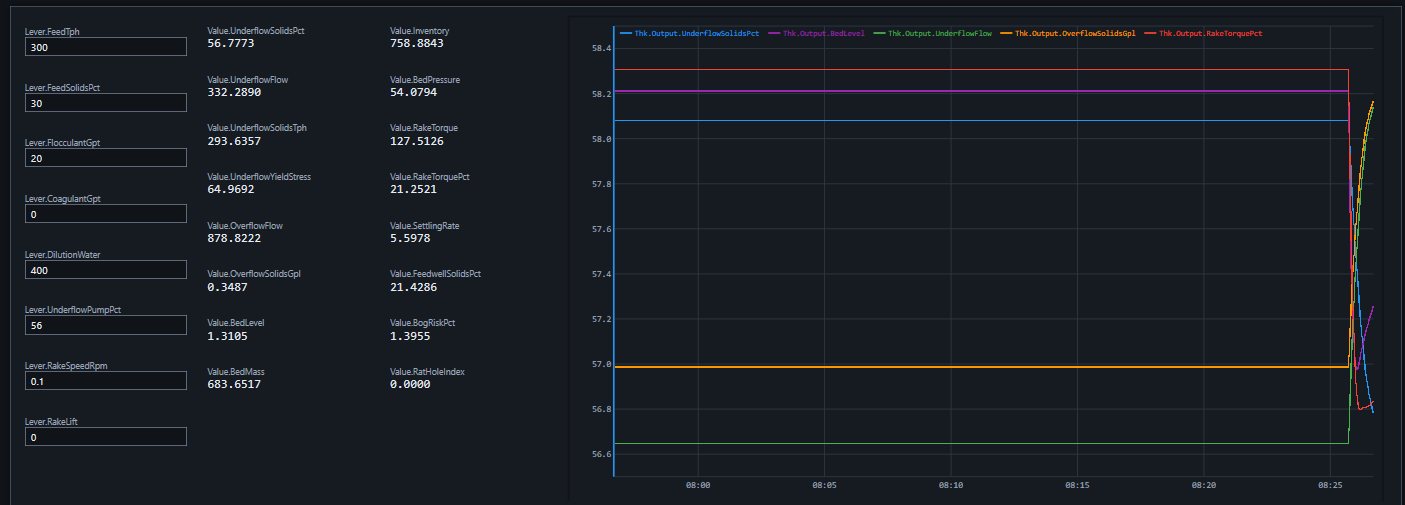
Step 9 - Move a lever and watch the bed respond
Values read from the live dashboard at minute 1 and minute 10. The flocculant step (minute 2) speeds up settling and clears the overflow; the pump step (minute 5) draws the bed down slightly (1.31 to 1.28 m) and underflow density eases from 56.8 to 56.1 % w/w while rake torque stays near 20 %. Holding underflow density while drawing more flow is exactly the interaction the thickener control strategy has to manage.
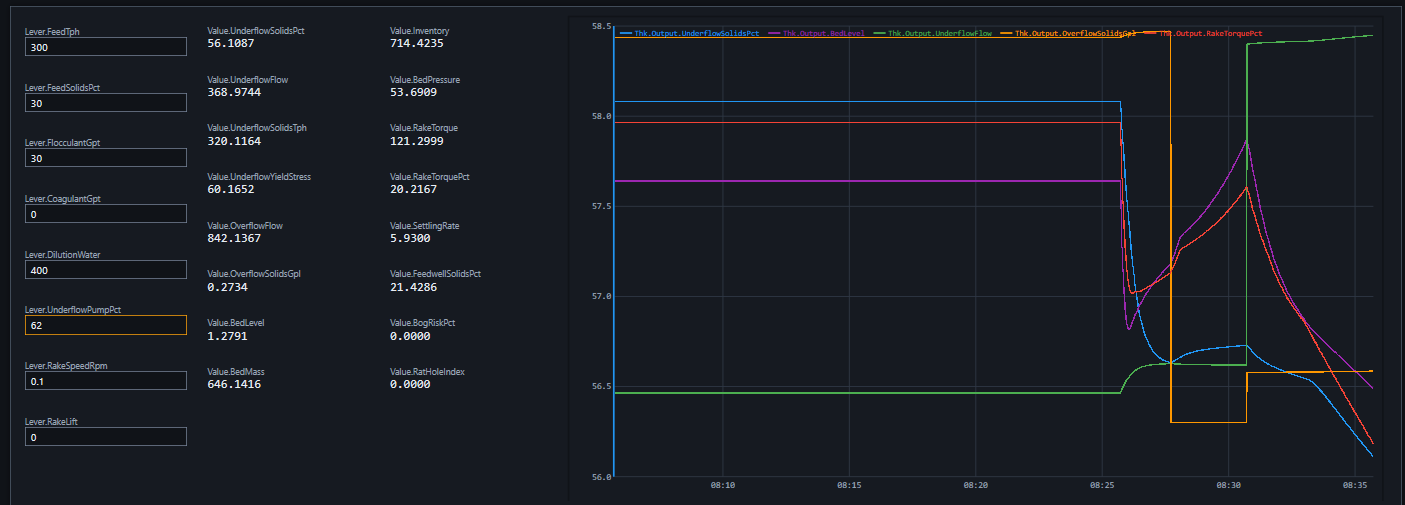
Checks before you trust the model
- At steady feed the bed level holds and inventory stops drifting
- Underflow density within 1-2 % w/w of the plant at a known bed level
- More flocculant clears the overflow; overdosing raises torque
- A faster pump draws the bed down and lowers underflow density
- Bog risk stays low in normal running and climbs before torque does
Request a demo to model your thickener and test its control strategy.
Talk to an engineerSources
- ProcessOpt RC3.1.4 - process model source code and editor dialogs, Aeterna Automation, 2026
- A consistent modelling methodology for secondary settling tanks in wastewater treatment, Bürger, Diehl and Nopens, Water Research 45(6), 2011
- A mathematical model for batch and continuous thickening of flocculated suspensions in vessels with varying cross-section, Bürger, Damasceno and Karlsen, Int. J. Mineral Processing 73, 2004
- The consolidation of concentrated suspensions, Buscall and White, J. Chem. Soc. Faraday Trans. 1, 83, 1987
- Thickener performance prediction from material characterisation, Usher and Scales, Chemical Engineering Journal 111, 2005
- Sedimentation and fluidisation, Part I, Richardson and Zaki, Trans. IChemE 32, 1954
- Wills' Mineral Processing Technology, 8th edition, Wills and Finch, Butterworth-Heinemann, 2016