
ProcessOpt tutorial: Crusher Model: Dimension Settings, Power and Bowl Level
Set the CSS, cavity and power of a cone crusher model - step by step in ProcessOpt
1 Fundamental
What breaks is set by the CSS; how much passes is set by what sits in the cavity.
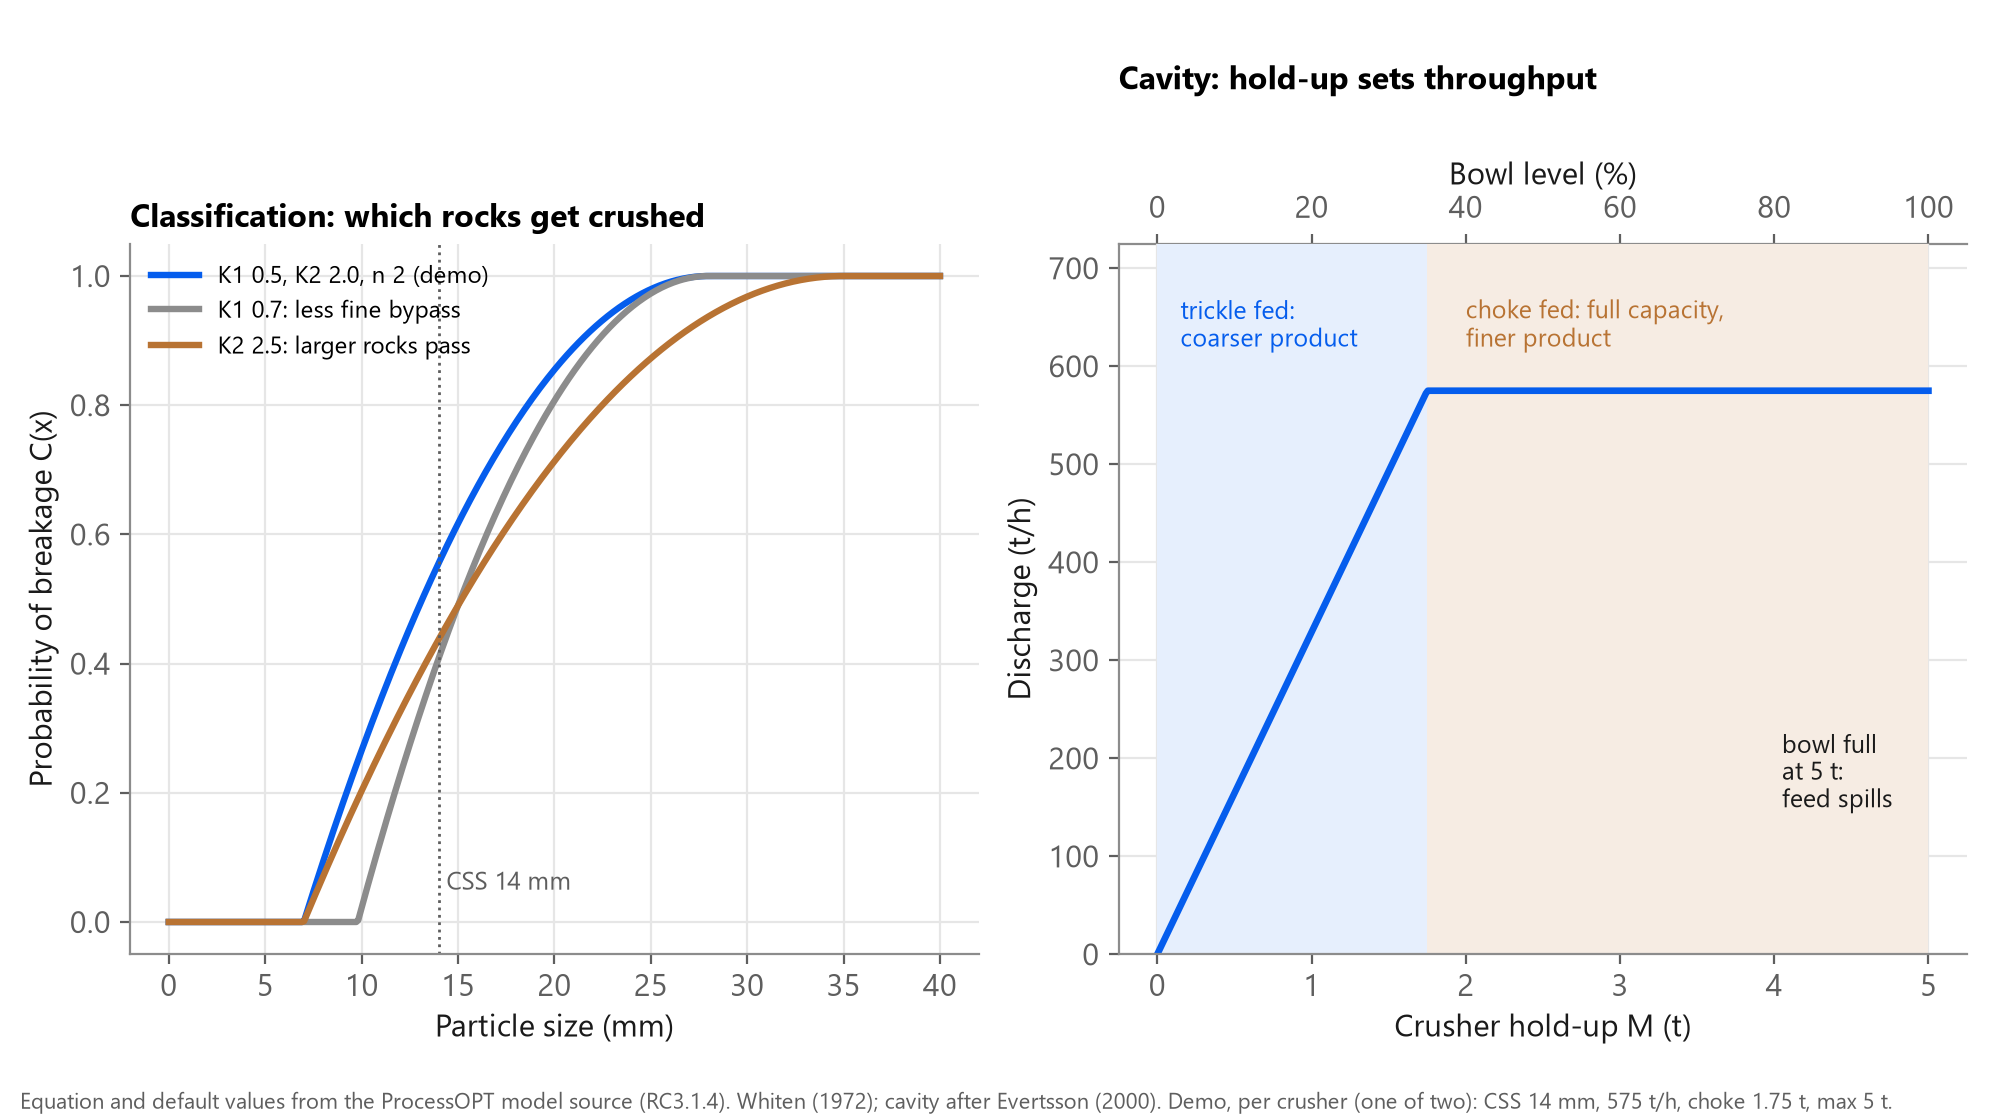
The crusher model has two halves: what breaks, and how much passes
Whiten (1972): a rock smaller than K1 passes, larger than K2 always breaks, in between with probability C(x). The cavity model (after Evertsson) adds inventory: trickle fed below the choke mass, choke fed above it, spilling when the bowl is full.
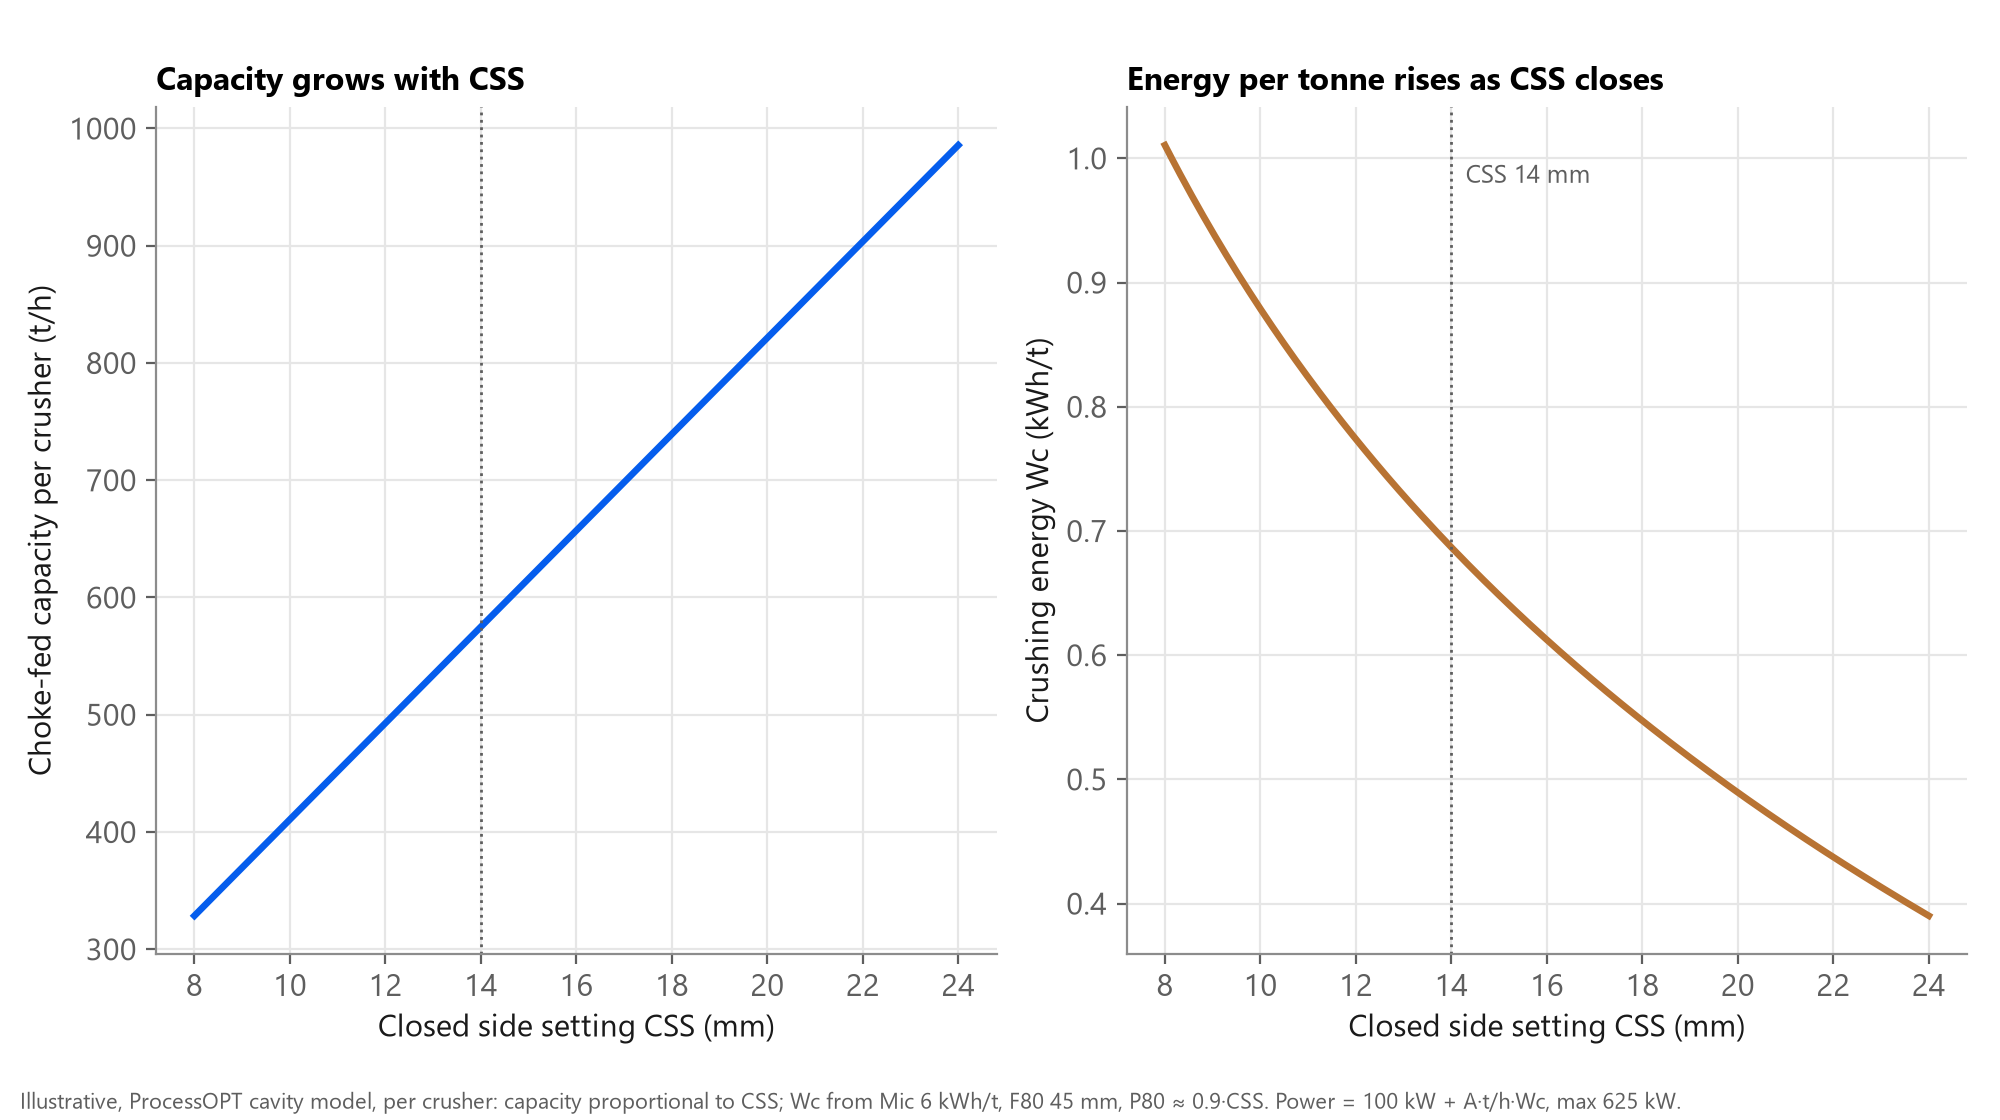
Closing the CSS trades capacity for a finer product
Illustrative shape from the model equations. This trade-off is why CSS, bowl level and power are worth controlling together.
2 Objective
A crusher model whose CSS, bowl level and power behave like the machine on the plant.
By the end you will have
- A Whiten crusher with CSS as a live, adjustable tag
- Cavity hold-up, bowl level, choke and spill each scan
- Motor power with no-load, work index and motor limit
- Specific energy and feed F80 as outputs
- A model ready for bowl-level and power control loops
3 Step by step
Every screen below is a real ProcessOpt screenshot.
Step 1 - Add a Simulation node and wire it into the scan
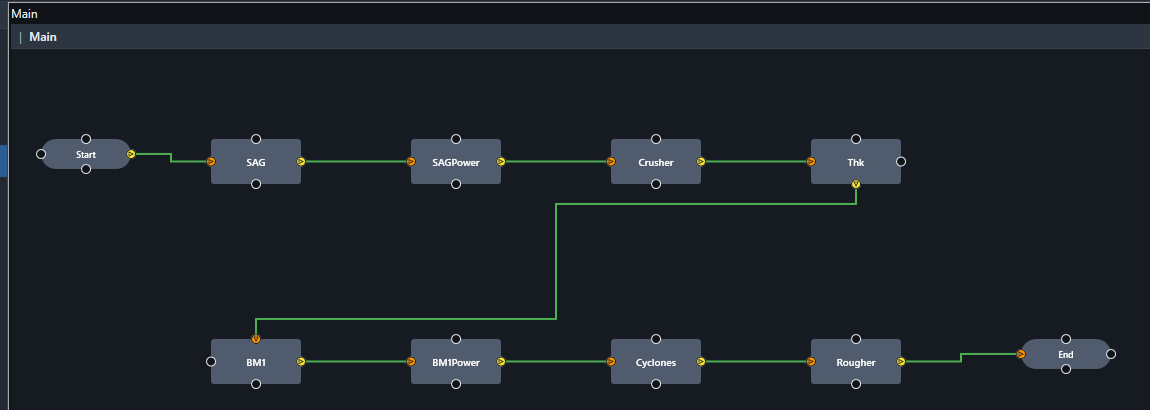
Every model in ProcessOpt runs inside a Simulation node. The node is executed once per scan cycle in the order of the graph, so place it after the logic that writes its inputs and before the logic that reads its outputs.
- Project Configuration > Logic Editor
- Right-click the canvas > add a Simulation node, name it Crusher
- Connect Start > Crusher > End so it runs every scan cycle (1 s here)
- One node per unit: the demo project has eight models on one canvas
Step 2 - Choose the model type and name the I/O tags
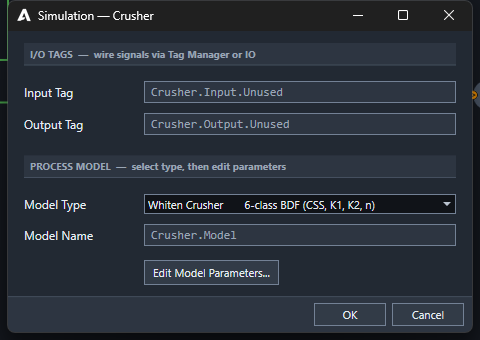
- Double-click the node to open the Simulation dialog
- Model Type: Whiten Crusher (6-class BDF: CSS, K1, K2, n)
- Input Tag and Output Tag are the two headline signals; every other result gets its own tag automatically
- Press Edit Model Parameters... for the full model sheet
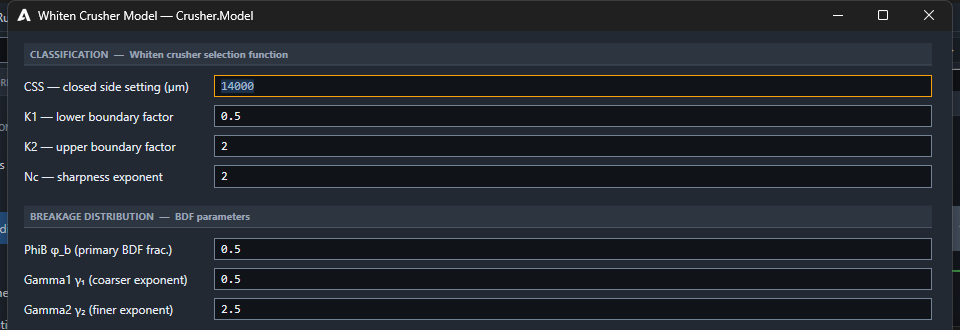
Step 3 - Dimension settings: CSS and the classification function
CSS is also a tag (Crusher.CSS), so an operator or the crusher control loop can move it while the model runs. K1 and K2 scale with CSS; tightening CSS lowers both boundaries and makes the product finer.
- CSS 14,000 µm: the closed side setting, the crusher's main dimension
- K1 0.5 × CSS: rocks smaller than this pass unbroken
- K2 2.0 × CSS: rocks larger than this are always broken
- Nc 2: how sharply the probability rises between K1 and K2
- φb, γ1, γ2: the breakage distribution (keep defaults without test data)
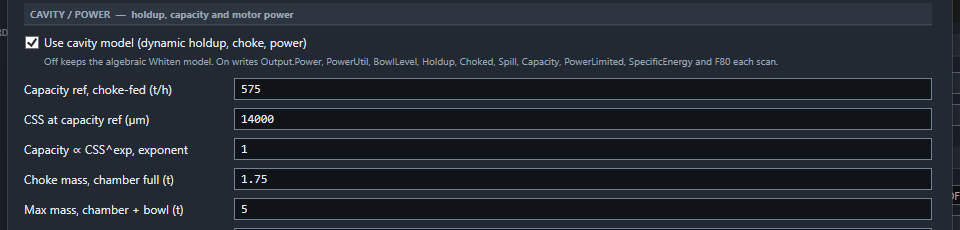
Step 4 - Turn on the cavity model: capacity, choke and bowl
Bowl level = hold-up / max mass. Below the choke mass the crusher discharges in proportion to its hold-up (trickle fed). At or above it, discharge equals capacity. That is the behaviour the bowl-level loop has to manage.
- Tick Use cavity model to get hold-up, bowl level, choke and spill
- Capacity ref 575 t/h per crusher, choke-fed at CSS 14 mm; capacity ∝ CSS^1
- Choke mass 1.75 t: the chamber is full and the crusher is choke-fed
- Max mass 5 t: chamber + bowl; above it feed spills
- Choke fineness 0.15: trickle feeding coarsens the product
Step 5 - Power: work index, no-load and motor rating
Power = no-load + A·throughput·Wc, where Wc comes from Mic and the feed and product sizes. When the motor limit is reached, capacity is limited by power rather than by volume.
- Mic 6 kWh/t: Morrell crushing work index of the ore
- No-load power 100 kW: read it from the idle crusher
- Motor rating 625 kW: the model caps power and flags PowerLimited
- Power scale 1.0: calibrate so model kW matches the meter at a known t/h

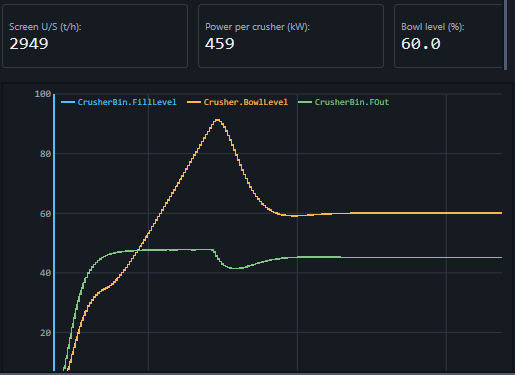
Step 6 - Run it: bowl level fills, the loop holds it at 60 %, power settles at 459 kW per crusher
The SABC demo has two identical pebble crushers in parallel. The model node represents one of them and is fed half the pebbles, so every value on the page is per crusher. Top: the page KPI tiles (power per crusher, bowl level). Bottom: the bowl level (orange) rises during start-up, overshoots to about 90 % and is pulled back to the 60 % set-point by LIC401. Power settles at 459 kW at about 480 t/h of pebbles per crusher.
Outputs the cavity model writes each scan
| Tag | Meaning | Unit |
|---|---|---|
| Crusher.Power / PowerUtil | motor power and % of rating | kW / % |
| Crusher.BowlLevel | hold-up / max mass | % |
| Crusher.Holdup | mass in chamber + bowl | t |
| Crusher.Choked | 1 when choke fed | 0/1 |
| Crusher.Spill | feed rejected when the bowl is full | t/h |
| Crusher.Capacity / PowerLimited | current capacity, 1 if motor-limited | t/h / 0/1 |
| Crusher.SpecificEnergy | power / throughput | kWh/t |
| Crusher.P80, CrushF80 | product and feed 80 % passing | µm |
Checks before you trust the model
- No-load power matches the idle reading
- Power within about 5 % of the meter at a known choke-fed rate
- Bowl level rises when feed exceeds capacity and the spill tag stays at zero in normal running
- Closing CSS by 1 mm lowers capacity in proportion and makes P80 finer
- Product P80 sits close to CSS for a cone crusher
Request a demo to model your crushing circuit.
Talk to an engineerSources
- ProcessOpt RC3.1.4 - process model source code and editor dialogs, Aeterna Automation, 2026
- The simulation of crushing plants with models developed using multiple spline regression, Whiten, W.J., J. S. Afr. Inst. Min. Metall. 72, 1972
- Power prediction for cone crushers, Andersen and Napier-Munn, Third Mill Operators' Conference, AusIMM, 1988
- Cone crusher performance (PhD thesis), Evertsson, C.M., Chalmers University of Technology, 2000
- An alternative energy-size relationship to that proposed by Bond, Morrell, S., Int. J. Mineral Processing 74, 2004
- Mineral Comminution Circuits: Their Operation and Optimisation (JKMRC Monograph 2), Napier-Munn, Morrell, Morrison and Kojovic, JKMRC, 1996