
ProcessOpt tutorial: Ball Mill PMB Model with Morrell Power
Build a ball mill model with Morrell power - step by step in ProcessOpt
1 Fundamental
A size-dependent breakage rate, scaled by filling and speed, and an overflow discharge.
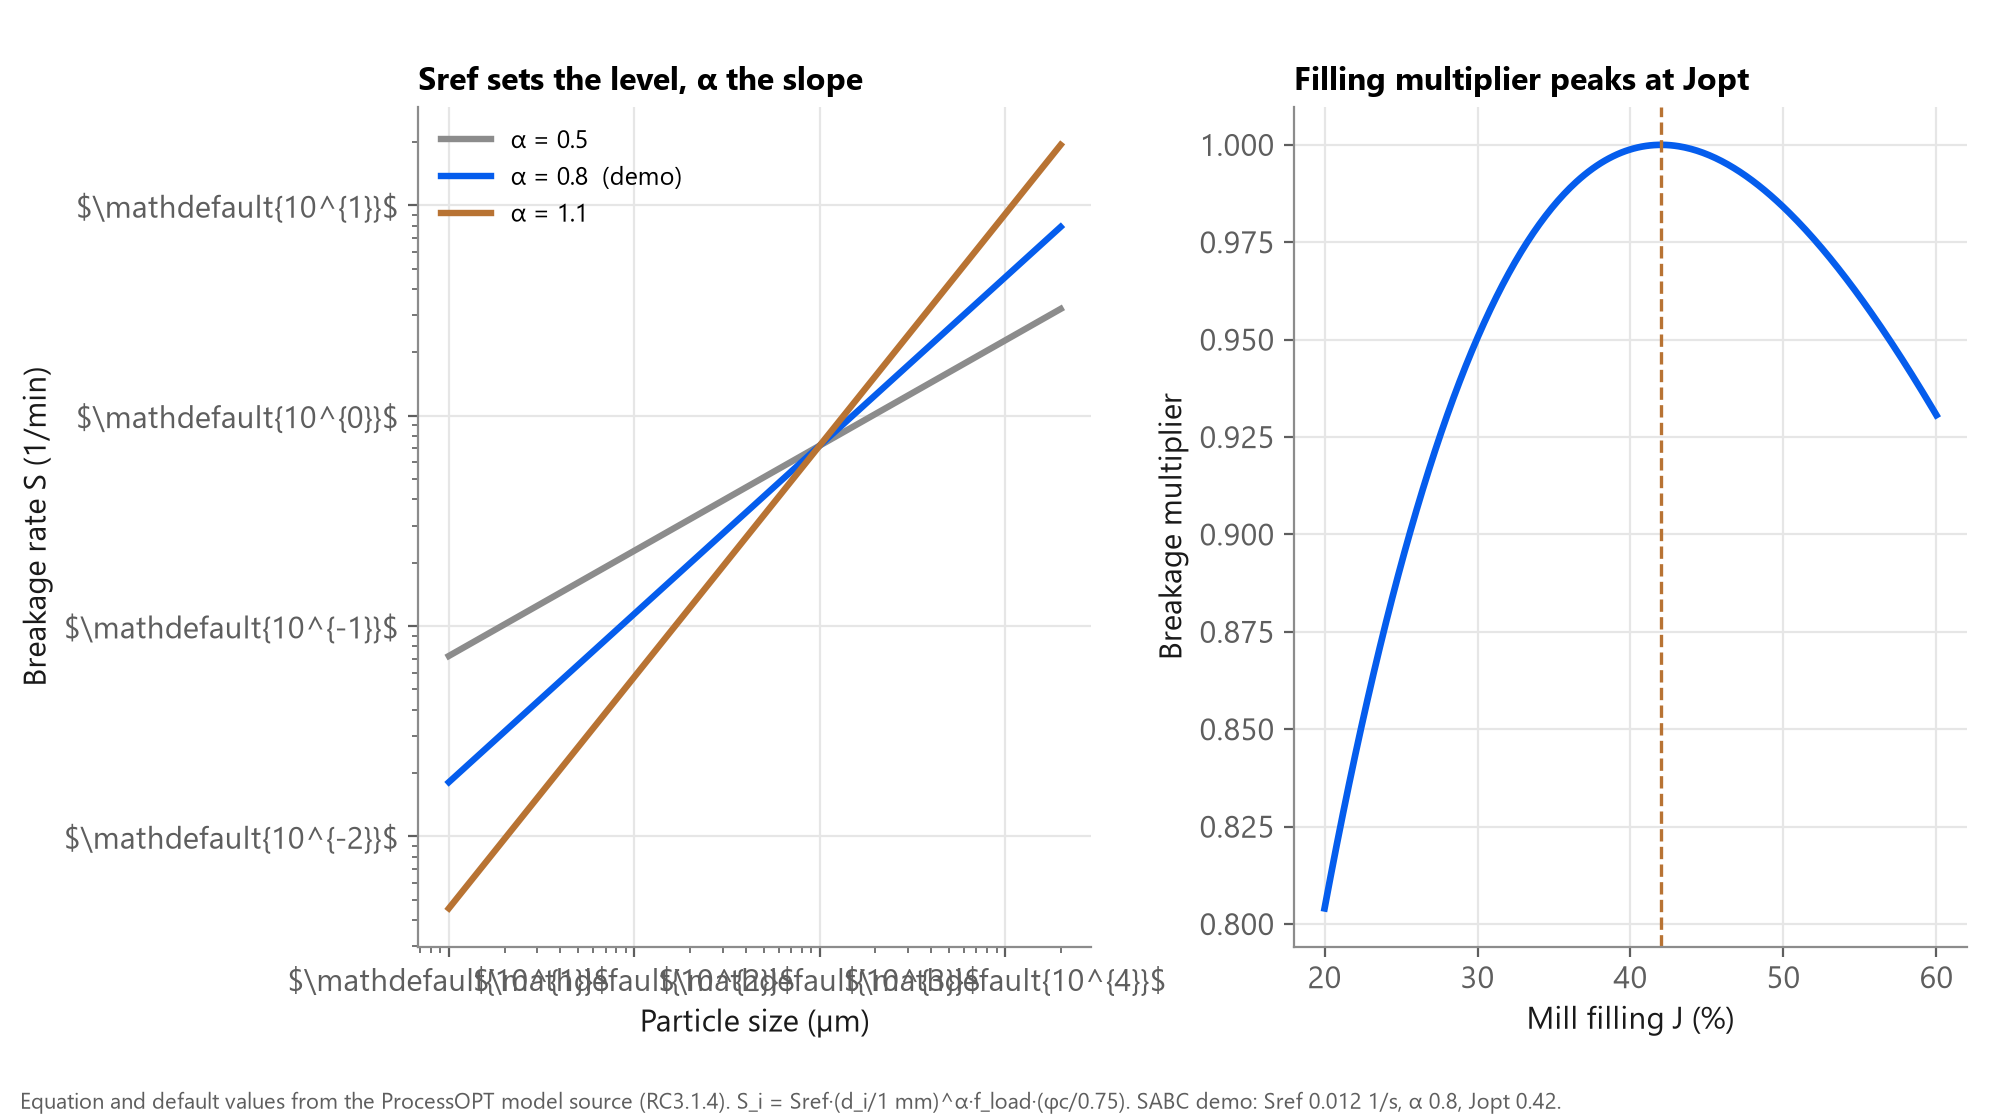
Ball mill breakage: a size-dependent rate scaled by mill filling
Same population balance as the SAG model, with an overflow discharge instead of a grate. Feeds from screen undersize, crusher product and cyclone underflow each carry their own % solids.
2 Objective
A ball mill model whose power and product size respond to circulating load and feed.
By the end you will have
- A Ball Mill PMB node fed by up to three streams
- Filling, weight, product P80 and size distribution as tags
- Power from a Morrell node calibrated to the motor
- A mill ready to close with the Plitt cyclone tutorial
3 Step by step
Every screen below is a real ProcessOpt screenshot.
Step 1 - Add a Simulation node and wire it into the scan
Every model in ProcessOpt runs inside a Simulation node. The node is executed once per scan cycle in the order of the graph, so place it after the logic that writes its inputs and before the logic that reads its outputs.
- Project Configuration > Logic Editor
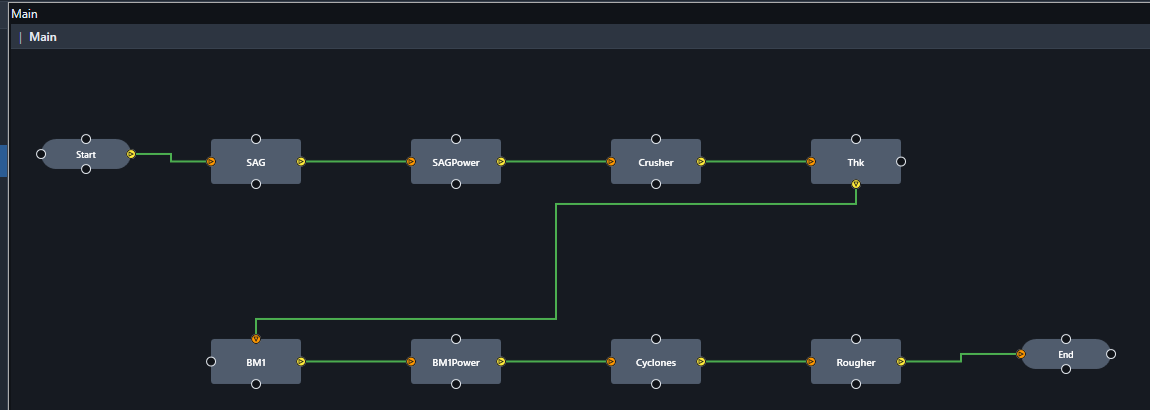
- Right-click the canvas > add a Simulation node, name it BM1
- Connect Start > BM1 > End so it runs every scan cycle (1 s here)
- One node per unit: the demo project has eight models on one canvas
Step 2 - Choose the model type and name the I/O tags
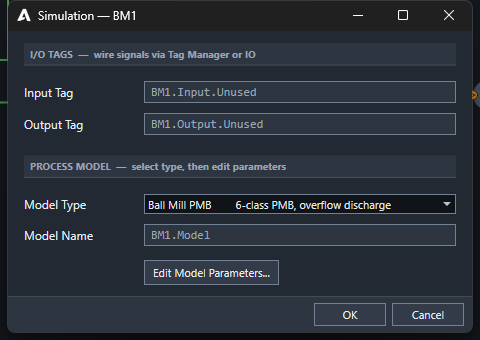
- Double-click the node to open the Simulation dialog
- Model Type: Ball Mill PMB (6-class PMB, overflow discharge)
- Input Tag and Output Tag are the two headline signals; every other result gets its own tag automatically
- Press Edit Model Parameters... for the full model sheet
Step 3 - Operation, geometry and ball charge
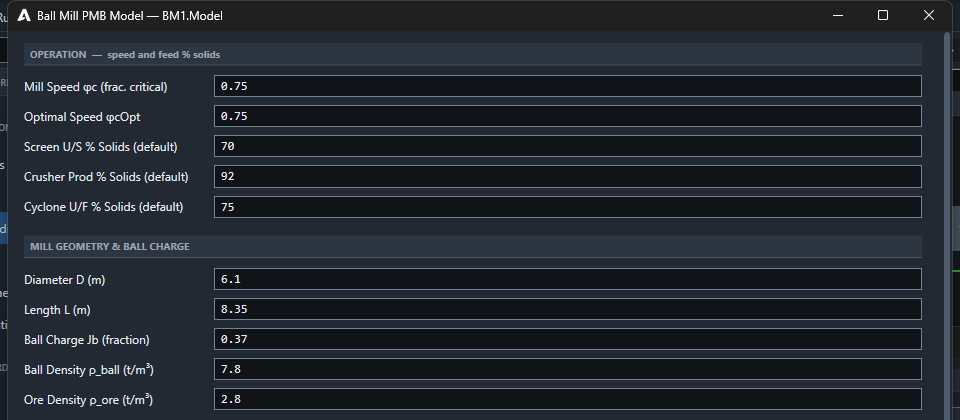
- Speed φc 0.75, optimal speed 0.75
- Feed % solids per stream: screen undersize 70, crusher product 92, cyclone underflow 75
- D 6.1 m, L 8.35 m, ball charge Jb 0.37
- Ball 7.8 and ore 2.8 t/m³
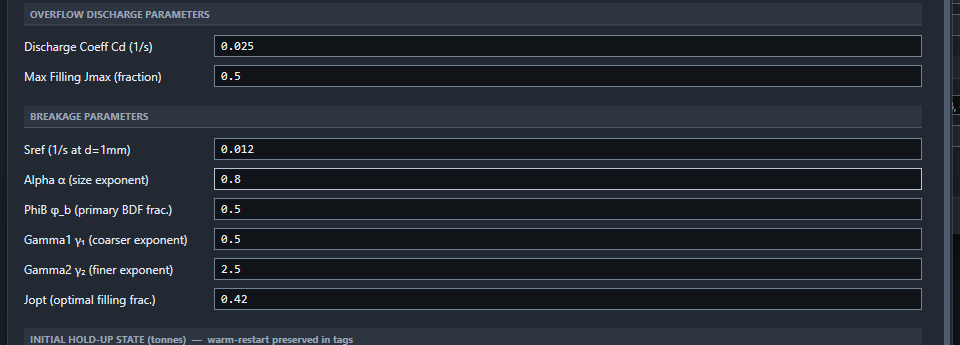
Step 4 - Overflow discharge and breakage
- Discharge coefficient Cd 0.025 1/s; max filling Jmax 0.5
- Sref 0.012 1/s at 1 mm, α 0.8
- Jopt 0.42: filling where breakage peaks
- Calibrate Cd for filling, then Sref for mill product size
Step 5 - Add a Morrell power node per mill
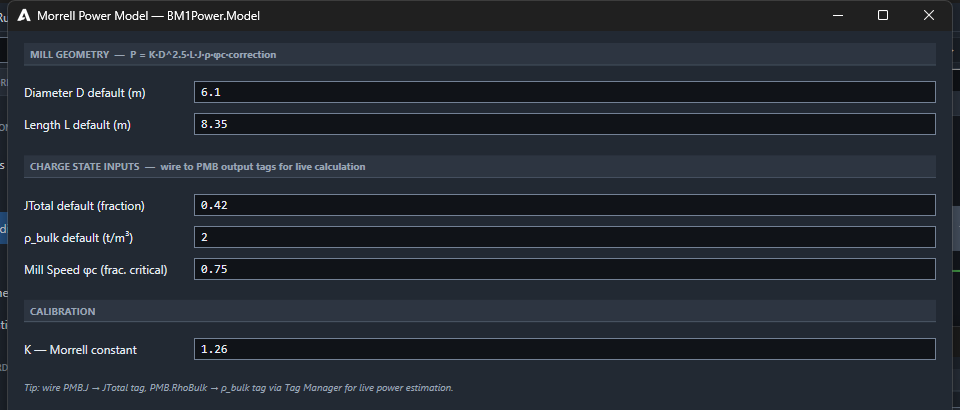
- The ball mill PMB has no built-in power: add a Morrell Power node (BM1Power)
- D 6.1, L 8.35, J 0.42, ρ bulk 2.0, φc 0.75, K 1.26
- Wire BM1.J, BM1.RhoBulk and BM1.PhiC to it each scan
- Calibrate K against the motor kW
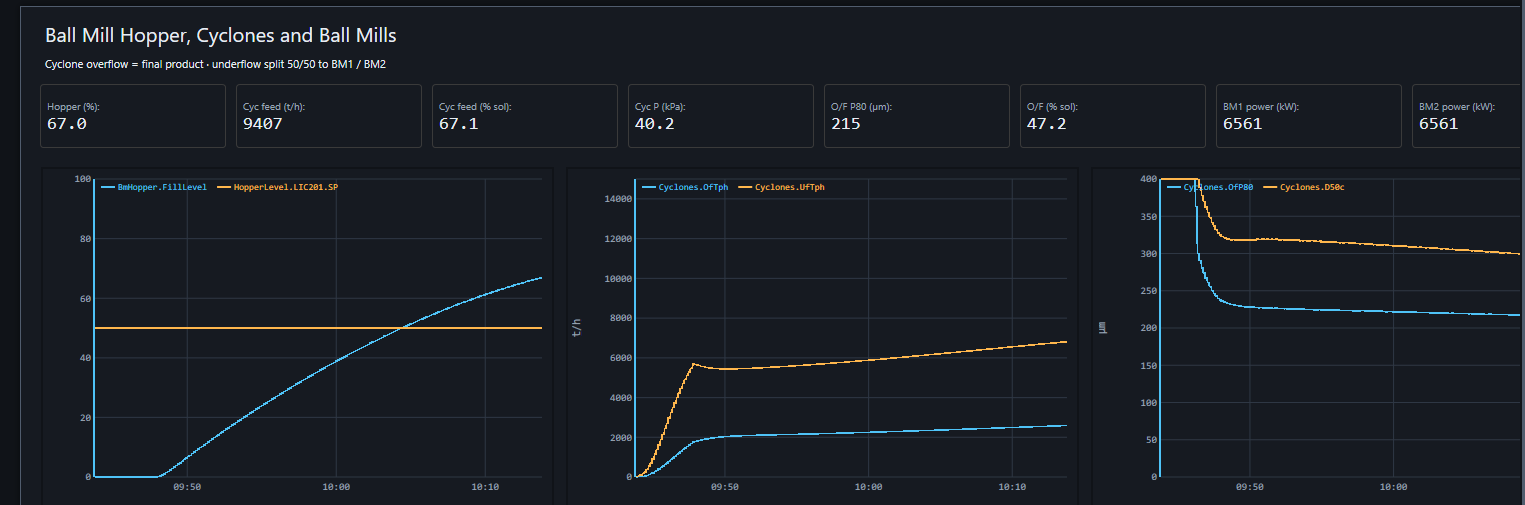
Step 6 - Run it: 6.6 MW per mill and a 215 µm cyclone overflow
BM1 and BM2 draw 6,561 kW each; ball mill filling rises toward about 0.45 as the circulating load builds, and the cyclone overflow P80 settles near 215 µm.
Checks before you trust the model
- Power within about 5 % of the motor after K calibration
- Filling J settles; it does not creep without a reason
- More circulating load lowers mill product P80 change per pass
- Mill product coarsens when feed rate rises at fixed cyclone settings
Request a demo.
Talk to an engineerSources
- ProcessOpt RC3.1.4 - process model source code and editor dialogs, Aeterna Automation, 2026
- Mineral Comminution Circuits: Their Operation and Optimisation (JKMRC Monograph 2), Napier-Munn, Morrell, Morrison and Kojovic, JKMRC, 1996
- Process Engineering of Size Reduction: Ball Milling, Austin, Klimpel and Luckie, SME-AIME, 1984
- Power draw of wet tumbling mills and its relationship to charge dynamics, Morrell, S., Trans. IMM Section C 105, 1996
- Wills' Mineral Processing Technology, 8th edition, Wills and Finch, Butterworth-Heinemann, 2016