
Flotation APC: Froth Velocity, Level and Air Control Strategies
How level, air and froth velocity are controlled in layers, and how a plant moves along its grade-recovery curve
The control layers
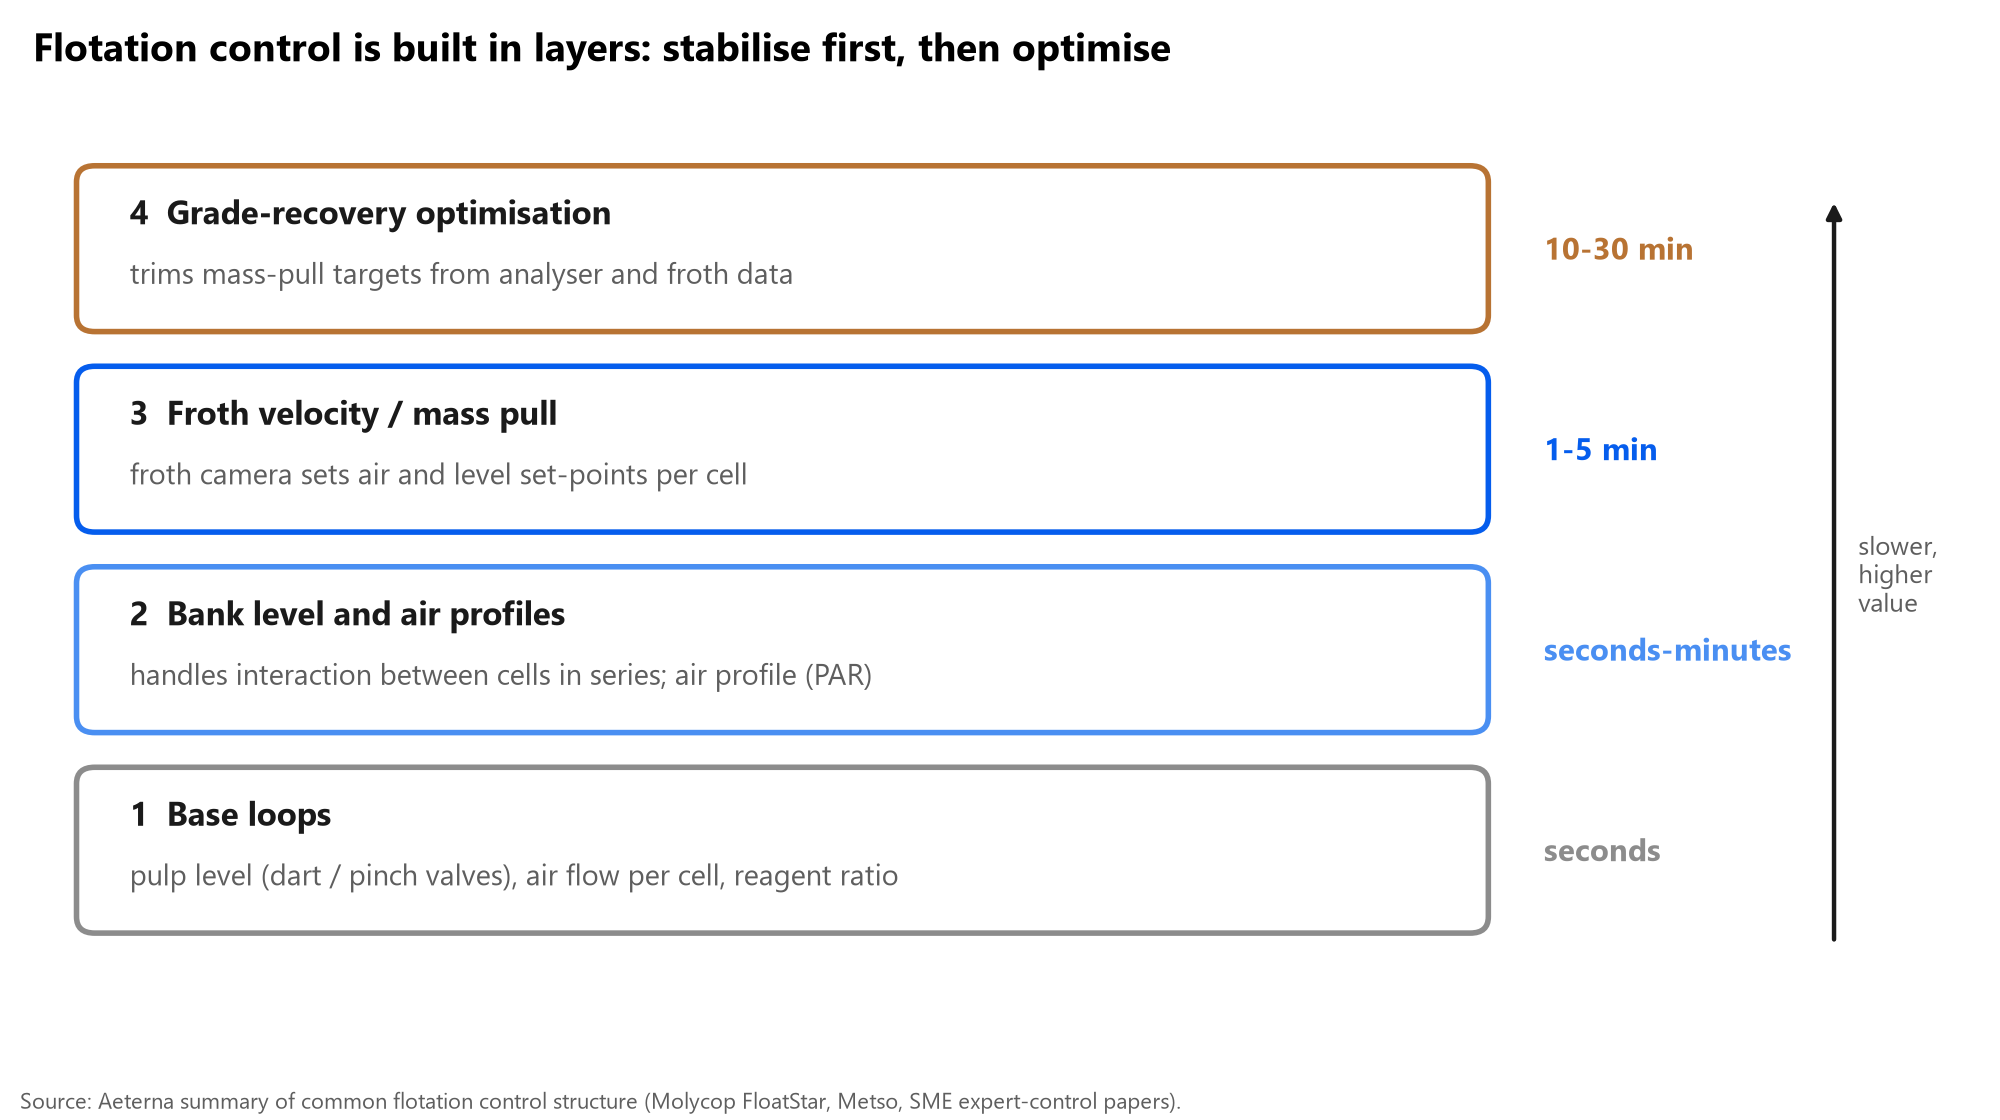
Layer 1 is the base: pulp level in each cell through dart or pinch valves, air flow per cell, and reagent addition in ratio to feed. Layer 2 handles the bank: cells in series interact because one cell's tailings are the next cell's feed, so a level controller that ignores its neighbours passes disturbances down the bank. Bank level stabilisers use feed-forward between cells and set the level and air profile down the bank.
Layer 3 uses froth measurements. Froth velocity (from cameras) tracks mass pull closely; a cascade sets air and level set-points per cell to hold a froth-velocity or mass-pull profile. Layer 4 trims those targets from online analyser assays or froth colour and bubble data to hold concentrate grade while maximising recovery. The order matters: optimisation on top of unstable base loops amplifies noise instead of adding recovery.
Level and air: the two hands on every cell
Pulp level sets froth depth: a deeper froth drains more water and gangue (higher grade, lower recovery); a shallower froth overflows faster (more mass pull, lower grade). Air rate sets bubble surface area and froth carrying rate, but too much air bursts bubbles and collapses the froth.
Expert rules used in plants follow the operators' logic: if froth velocity falls (for example with a softer or less floatable ore), lower the level set-point to raise mass pull; if it rises, raise the level set-point. Air is usually profiled down the bank, higher at the scavenger end where floatable mineral is scarce.
Peak air recovery: finding the right air rate
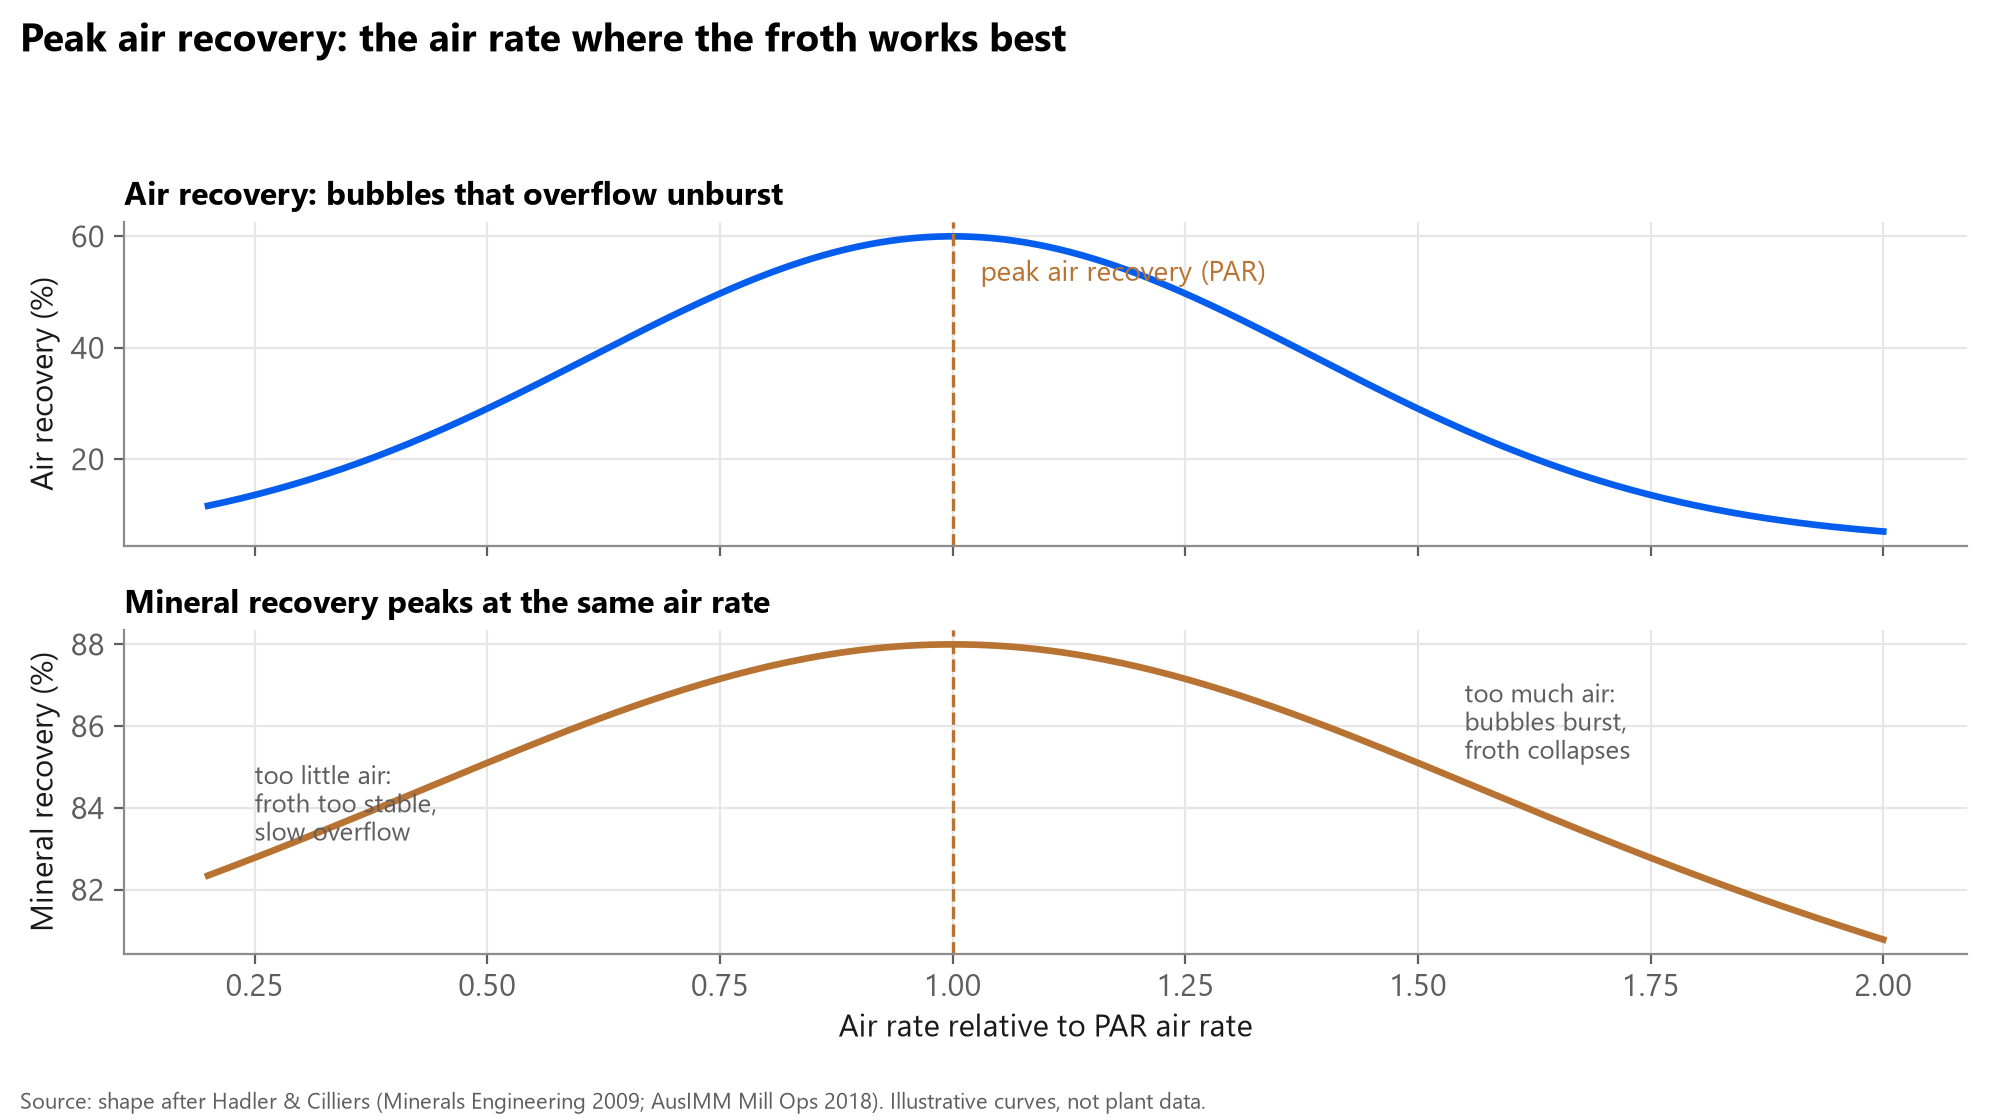
Air recovery is the fraction of air entering a cell that overflows the lip as unburst bubbles. Hadler and Cilliers showed that it peaks at a particular air rate, and that the same air rate gives the best mineral recovery the cell can achieve under its conditions. Running each cell at its PAR air rate down the bank gave the highest cumulative recovery in plant trials, often at a lower total air rate.
Measuring air recovery needs froth velocity, overflowing froth height and lip length, plus the air flow; a 2018 method uses froth velocity and height trends alone where air flow is unmeasured. The optimum shifts with feed particle size, so PAR is a moving target and suits automatic tracking. Anglo American Platinum uses PAR across its plants alongside mass-pull control; Rio Tinto's Kennecott control system has used it since 2013.
Fast signals: why the froth matters
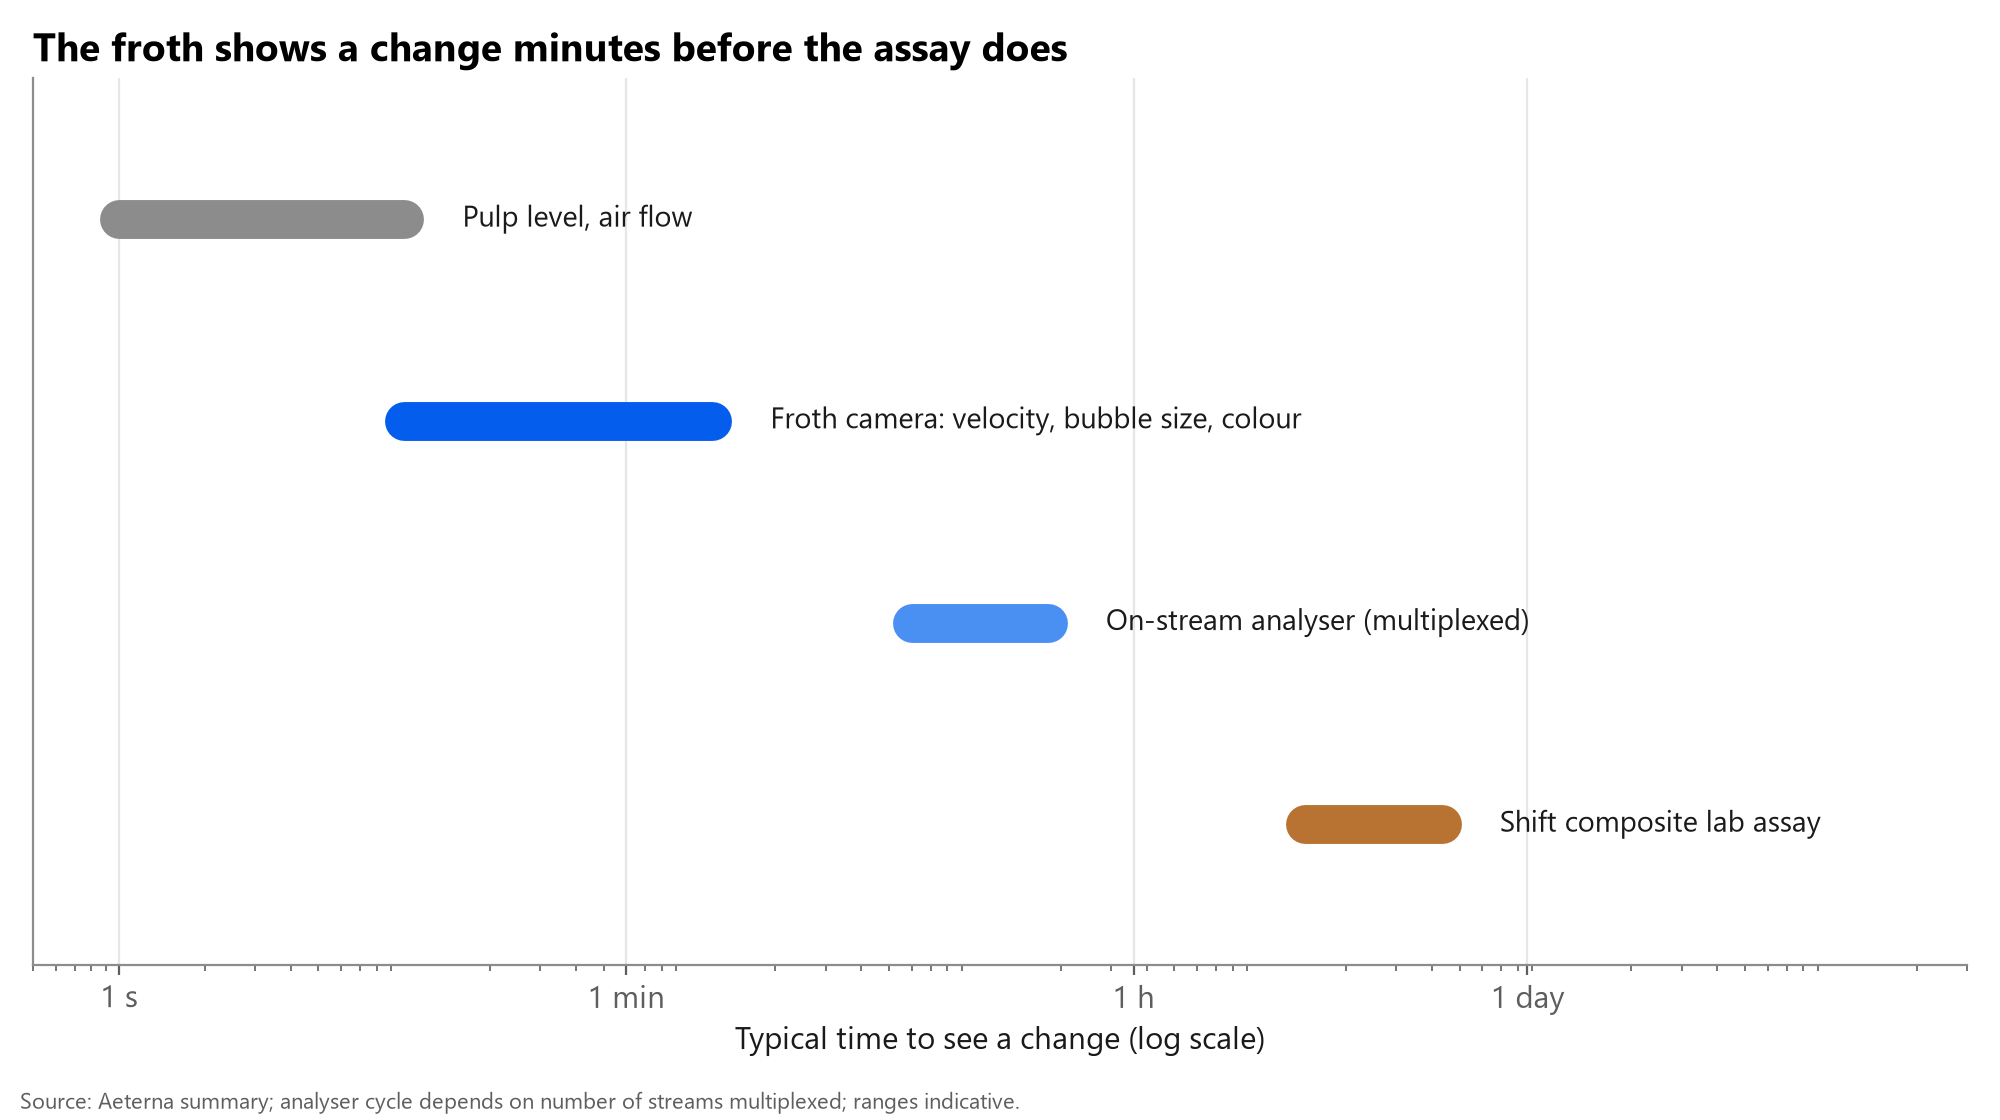
Level and air respond in seconds but say nothing about what is floating. Froth cameras measure velocity, bubble size, stability and colour within seconds to minutes. On-stream analysers cycle through many streams, so each assay updates every 10-30 minutes; shift composites arrive hours later. A controller that waits for the assay is always correcting yesterday's ore. Froth measurements let it act first, with the analyser confirming the result.
Grade-recovery set-point management
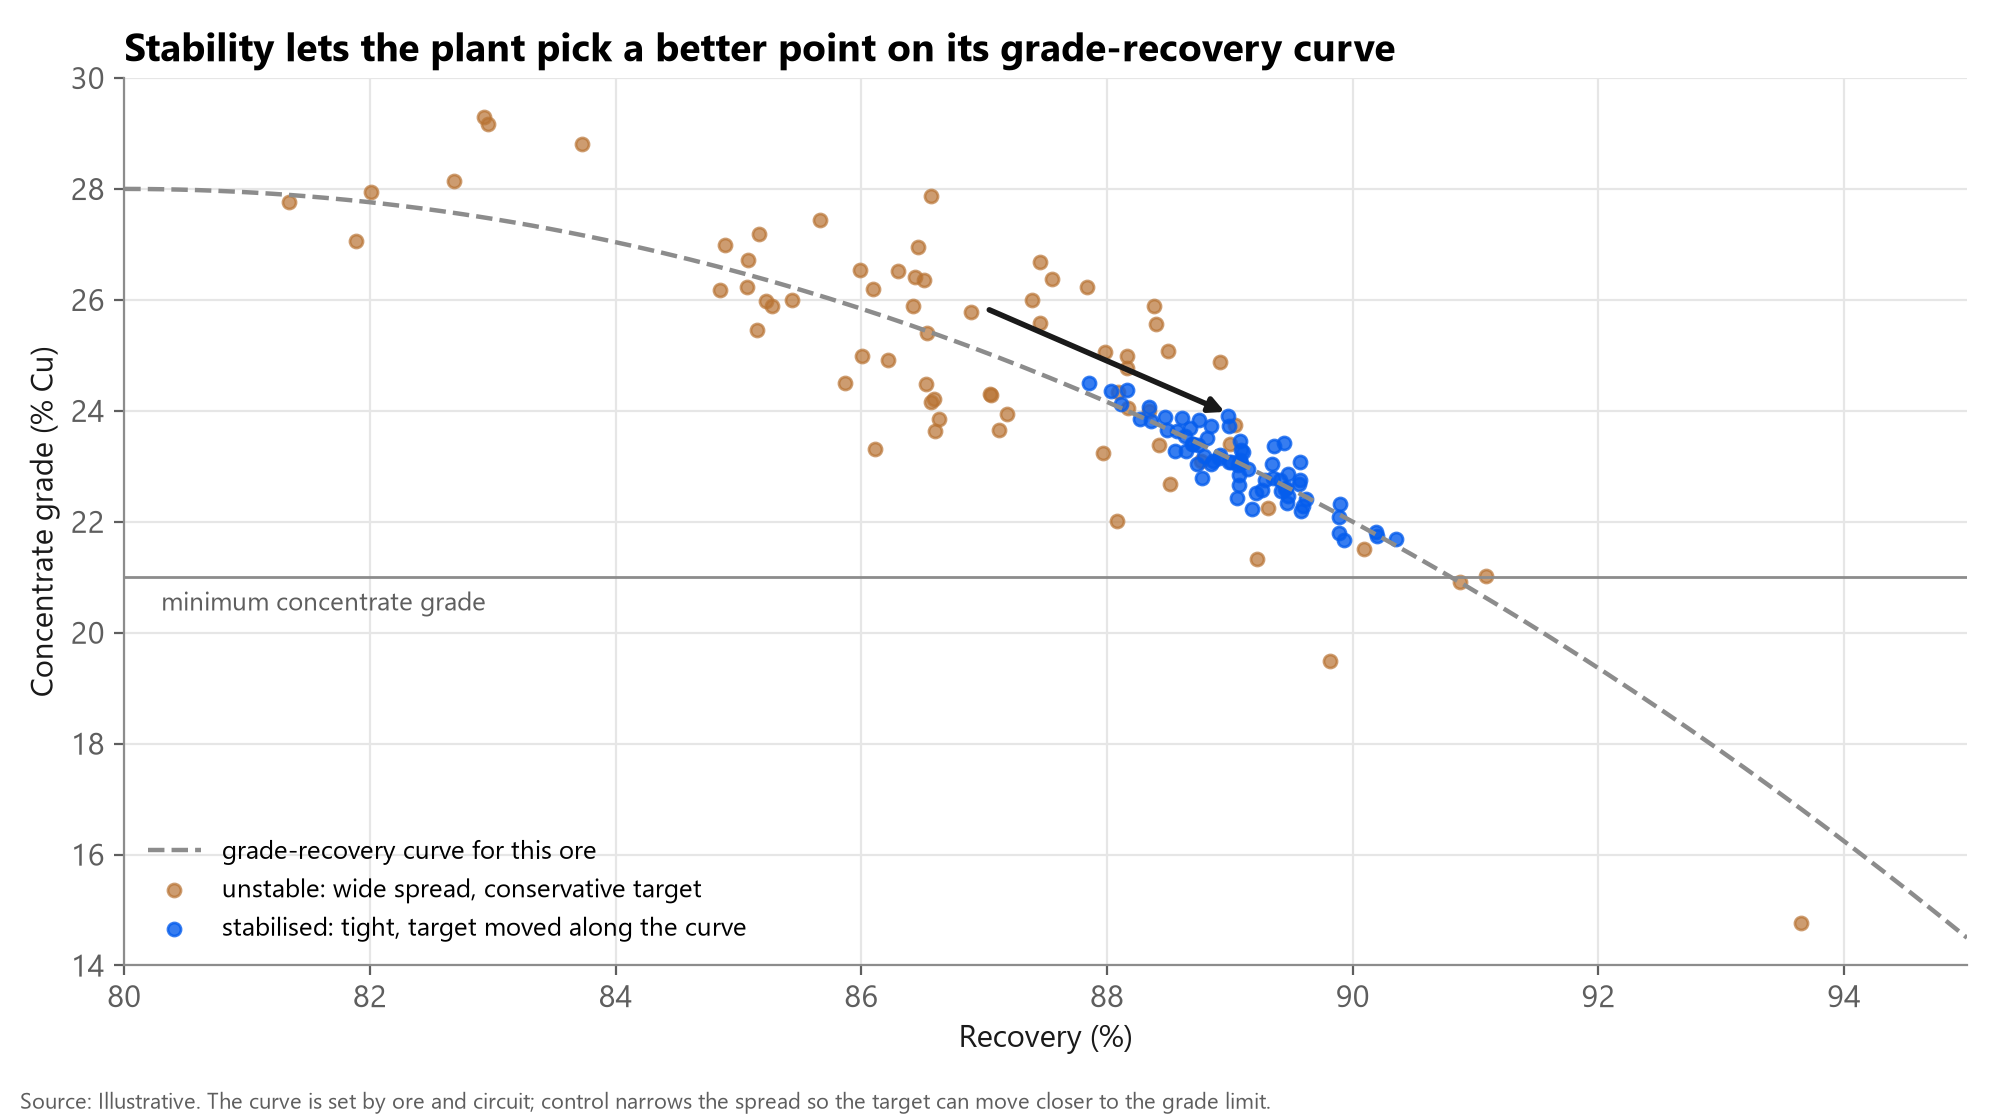
The grade-recovery curve is set by ore and circuit; control cannot move the curve, but it can change where the plant sits on it. An unstable plant sees a wide spread of grades and so targets a conservative, high grade to stay above the contract limit. Narrowing the spread lets the target move closer to the limit, which lifts average recovery at the same compliance.
A practical grade-recovery layer trims mass-pull set-points from the analyser's concentrate and tailings grades, with froth colour and velocity as fast proxies, and respects limits on concentrate grade, cleaner capacity and launder flow.
Published results
| Site / system | Result | Source |
|---|---|---|
| FloatStar Level Stabiliser, many plants | +0.5-1.3 % recovery, payback 1-3 months | Molycop tech sheet (vendor) |
| Level control alone | up to +1 % recovery | SAIMM 2005 paper (via Molycop) |
| Kennecott, PAR air control | ~+1 % Cu and Au recovery; ~3,000 t Cu, ~5,000 oz Au a year | REF impact case study (Imperial College) |
| RTB Bor Veliki Krivelj, OCS-4D + VisioFroth | +3 % recovery after new cells' +3 % | Metso case study (vendor) |
| Early assay-based control | +0.5 % Cu recovery | 911 Metallurgist OSA benefits |
Estimated ROI of flotation levers
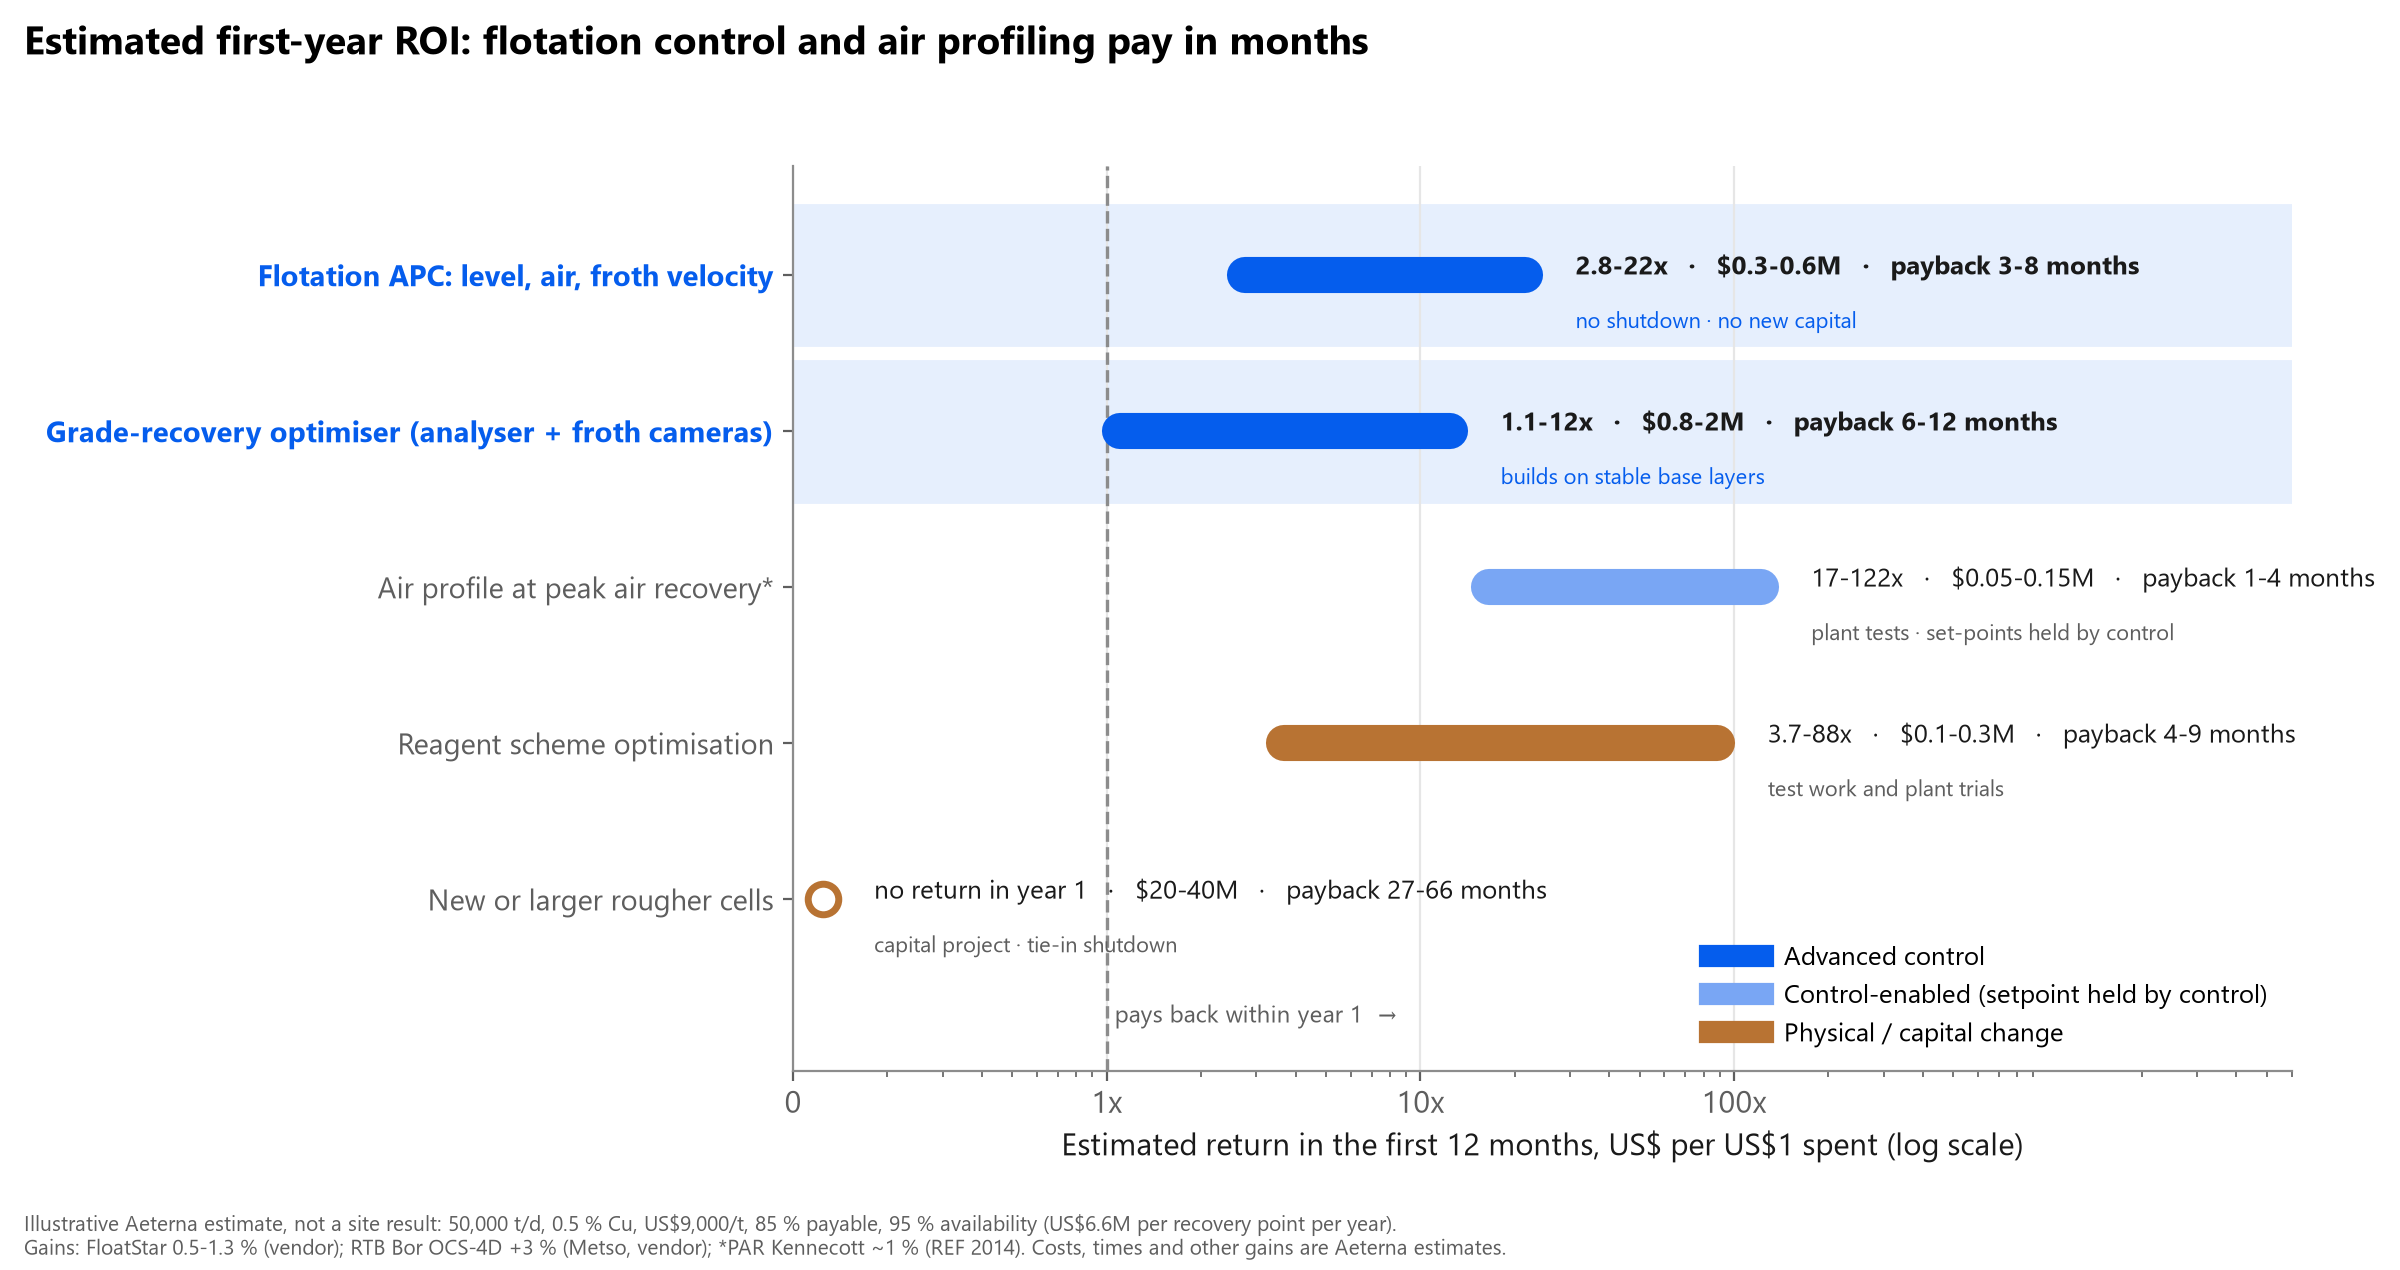
On an illustrative copper concentrator (50,000 t/d, 0.5 % Cu, US$9,000/t, 85 % payable, 95 % availability), one point of recovery is worth about US$6.6M a year. Stabilising flotation control returns about 3-22x its cost in year one; a grade-recovery optimiser on top returns about 1-12x as it needs instruments and a longer tuning period. PAR air profiling and reagent work cost little and also pay within months; they are best held in place by control. New rougher capacity may give the largest gain, but returns nothing in year one.
Control gains use published ranges (FloatStar, RTB Bor, Kennecott); all costs and times are Aeterna estimates including lost production.
| Lever | Gain | Est. cost incl. lost production | Time to value | Payback | Year-1 return |
|---|---|---|---|---|---|
| Flotation APC: level, air, froth velocity | 0.5-1.3 % rec. | $0.3-0.6M | 3-6 months | 3-8 months | 2.8-22x |
| Grade-recovery optimiser (analyser + froth cameras) | 1-3 % rec. | $0.8-2M | 6-9 months | 6-12 months | 1.1-12x |
| Air profile at peak air recovery* | 0.5-1 % rec. | $0.05-0.15M | 1-3 months | 1-4 months | 17-122x |
| Reagent scheme optimisation | 0.5-2 % rec. | $0.1-0.3M | 4-8 months | 4-9 months | 3.7-88x |
| New or larger rougher cells | 2-4 % rec. | $20-40M | 18-30 months | 27-66 months | 0x |
Aeterna angle
Aeterna's Froth Analyzer measures froth velocity, bubble size, stability and colour on rougher and cleaner cells; ProcessOpt runs the level, air and froth-velocity layers and the grade-recovery trim, with rules that operators can read. The honest pitch: stabilise first, then move the target, and measure the recovery gain against a baseline. Link to the published 'froth knows first' and 'bubble literature' posts.
Common misconceptions
- 'More air means more recovery.' Past peak air recovery, the froth collapses and recovery falls.
- 'Each cell's level loop can be tuned on its own.' Cells in series interact; tune the bank.
- 'An analyser is enough.' Its 10-30 minute cycle is too slow to stabilise; froth signals act first.
- 'Control moves the grade-recovery curve.' It moves the plant along the curve by narrowing the spread.
Where sources disagree or are uncertain
- Recovery gains are mostly reported by vendors or developers (Molycop, Metso, Imperial College licensees).
- PAR and mass-pull control are sometimes presented as alternatives; Anglo American Platinum uses both.
- The grade-recovery benefit of stability depends on the slope of the curve near the grade limit.
- Figures 2 and 4 are illustrative shapes, not plant data.
Ask for a flotation control review: we look at your level, air and froth data and estimate the recovery gain honestly.
Talk to an engineerSources
- FloatStar technical sheet (level stabiliser, flow optimiser), Molycop / Mintek
- Air rate adjustment to peak air recovery (PAR) to increase mineral production, REF 2014 impact case study, Imperial College London
- How to find the optimum air rate for flotation cells, Hadler & Cilliers, AusIMM Mill Operators' Conference, 2018
- The benefits of flotation bank air profiling, AusIMM Mill Operators' Conference, 2009
- An overview of optimizing strategies for flotation banks, 911 Metallurgist (review)
- Flotation Optimizer (froth speed set-points), Metso
- RTB Bor improves recovery at the Veliki Krivelj concentrator, Metso case study
- On-stream analyser benefits, 911 Metallurgist
- A practical approach to plant scale flotation optimisation, OneMine