
Circulating Load in Ball Mill-Cyclone Circuits: How Much Is Enough
Why more recycle adds capacity, why classification efficiency matters more, and where the practical limit sits
What circulating load is and how to measure it
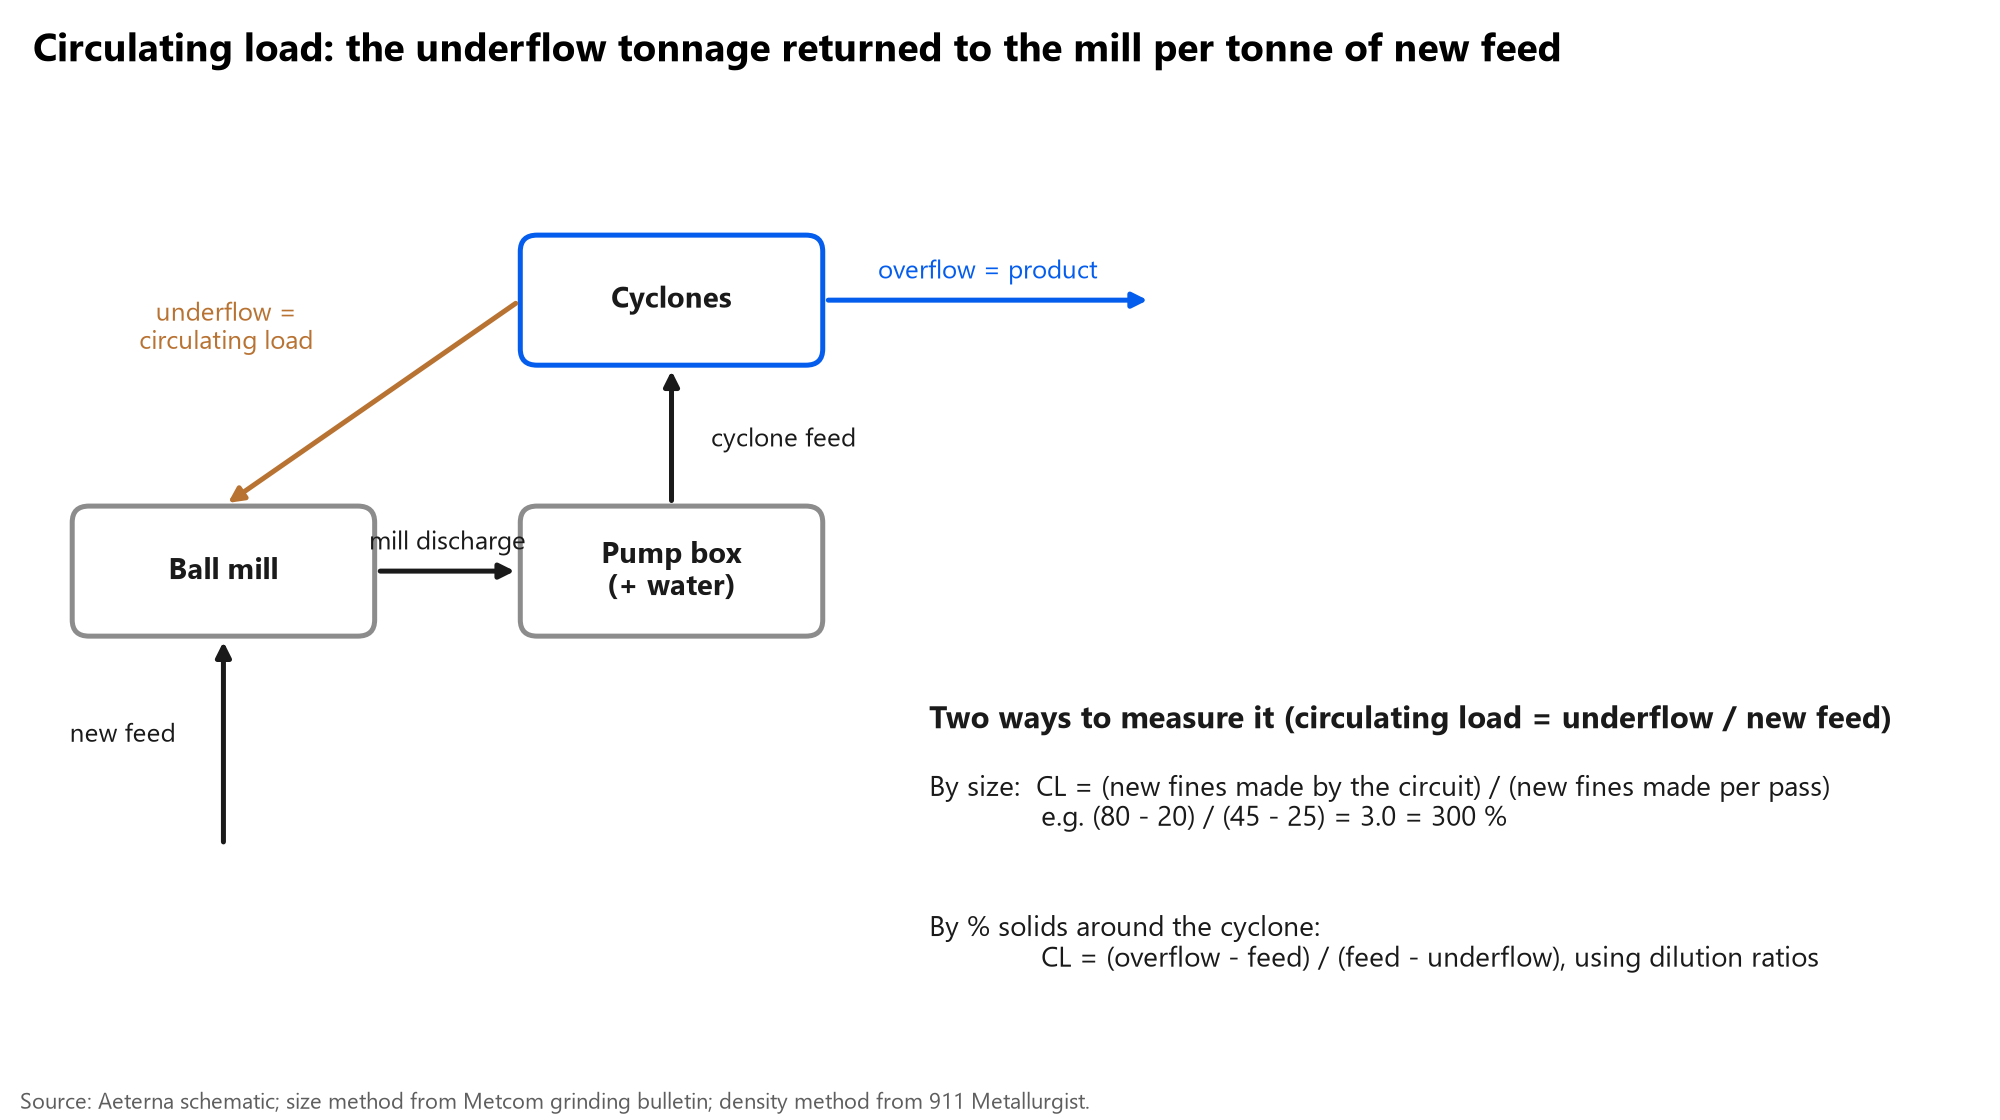
In a closed ball mill-cyclone circuit, cyclone underflow returns to the mill and overflow is the product. Circulating load (CL) is the underflow solids rate divided by the new feed rate, usually expressed as a percentage.
It can be measured from a survey in two ways. From size: CL = (new fines made by the circuit) / (new fines made per pass through the mill); for example, circuit feed 20 % passing 75 µm and overflow 80 % passing gives 60 points, mill feed 25 % and discharge 45 % passing gives 20 points per pass, so CL = 3.0 or 300 % (Metcom). From % solids around the cyclone: CL = (overflow dilution - feed dilution) / (feed dilution - underflow dilution), using water-to-solids ratios. Both are sensitive to sampling; the size method on a reverse-fed circuit is the most robust.
Why circulating load adds capacity
Breakage in a ball mill is roughly first order: the rate fines are made is proportional to the amount of coarse material in the mill. If finished product is removed quickly (a short pass and an efficient classifier), the mill holds more coarse material and every kilowatt goes into particles that still need grinding. A higher circulating load means a shorter pass through the mill and less over-grinding.
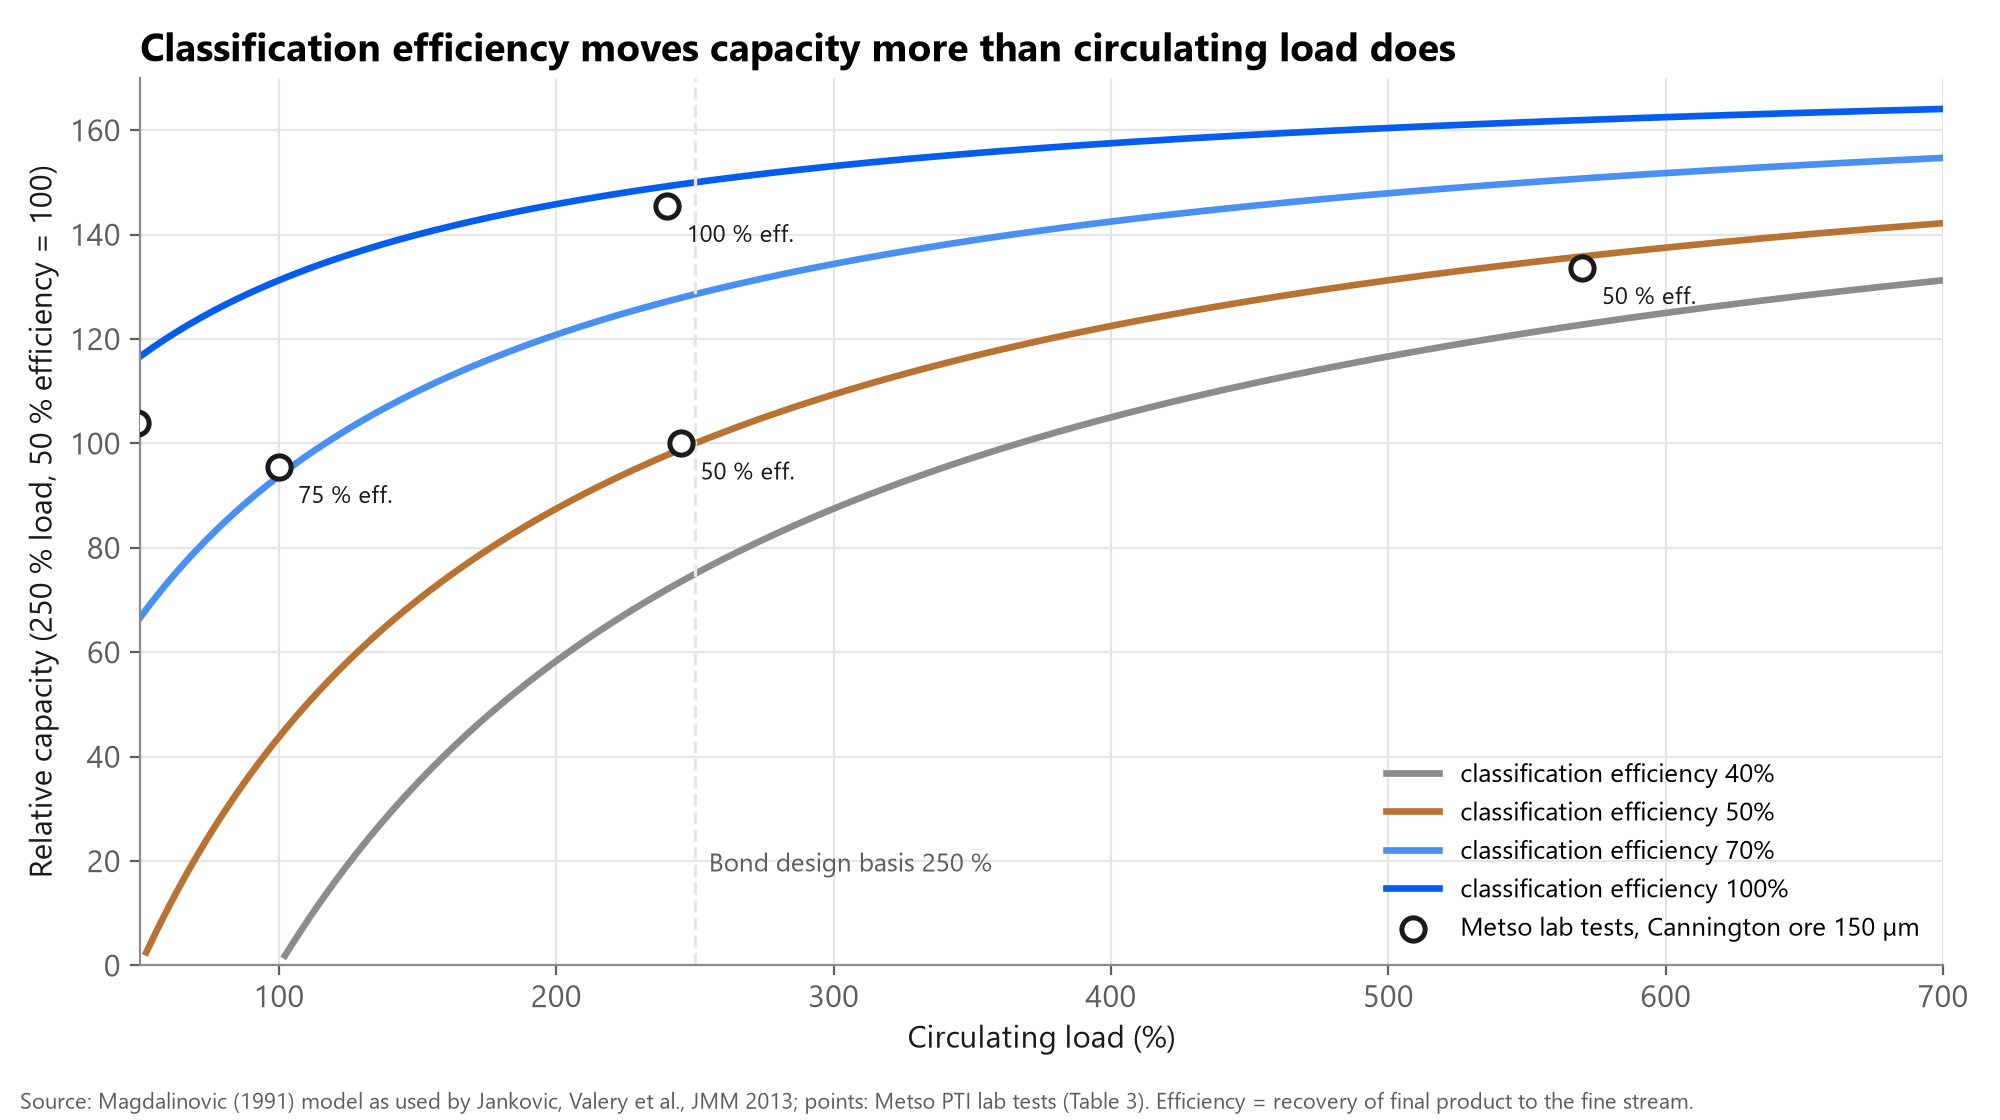
Davis's 1925 experiments showed capacity doubling when a classifier closes the circuit at 200 % load, and only 2.3x at 500 %. Bond adopted 250 % as the design basis for the work index method. The returns diminish because each extra pass costs pumping, cyclone capacity and mill volume.
Classification efficiency matters more
Magdalinovic's model (1991) expresses relative capacity as (1.5 + C - 1/E)/(1 + C), where C is the circulating load as a fraction and E the classification efficiency (recovery of finished product to the fine stream). Jankovic, Valery and colleagues at Metso (JMM 2013) tested it with locked-cycle lab grinding at controlled load and efficiency.
At 250 % load, raising efficiency from 50 % to 100 % lifted measured capacity by 45 % (model: 50 %). At 50 % efficiency, raising load from 250 % to 570 % lifted it by 34 % (model: 36 %). The model is more accurate when compared to a conventional closed-circuit baseline than to open circuit. The message for plants: fines going back to the mill in the underflow (bypass) cost as much capacity as a low circulating load.
Where the practical limit is
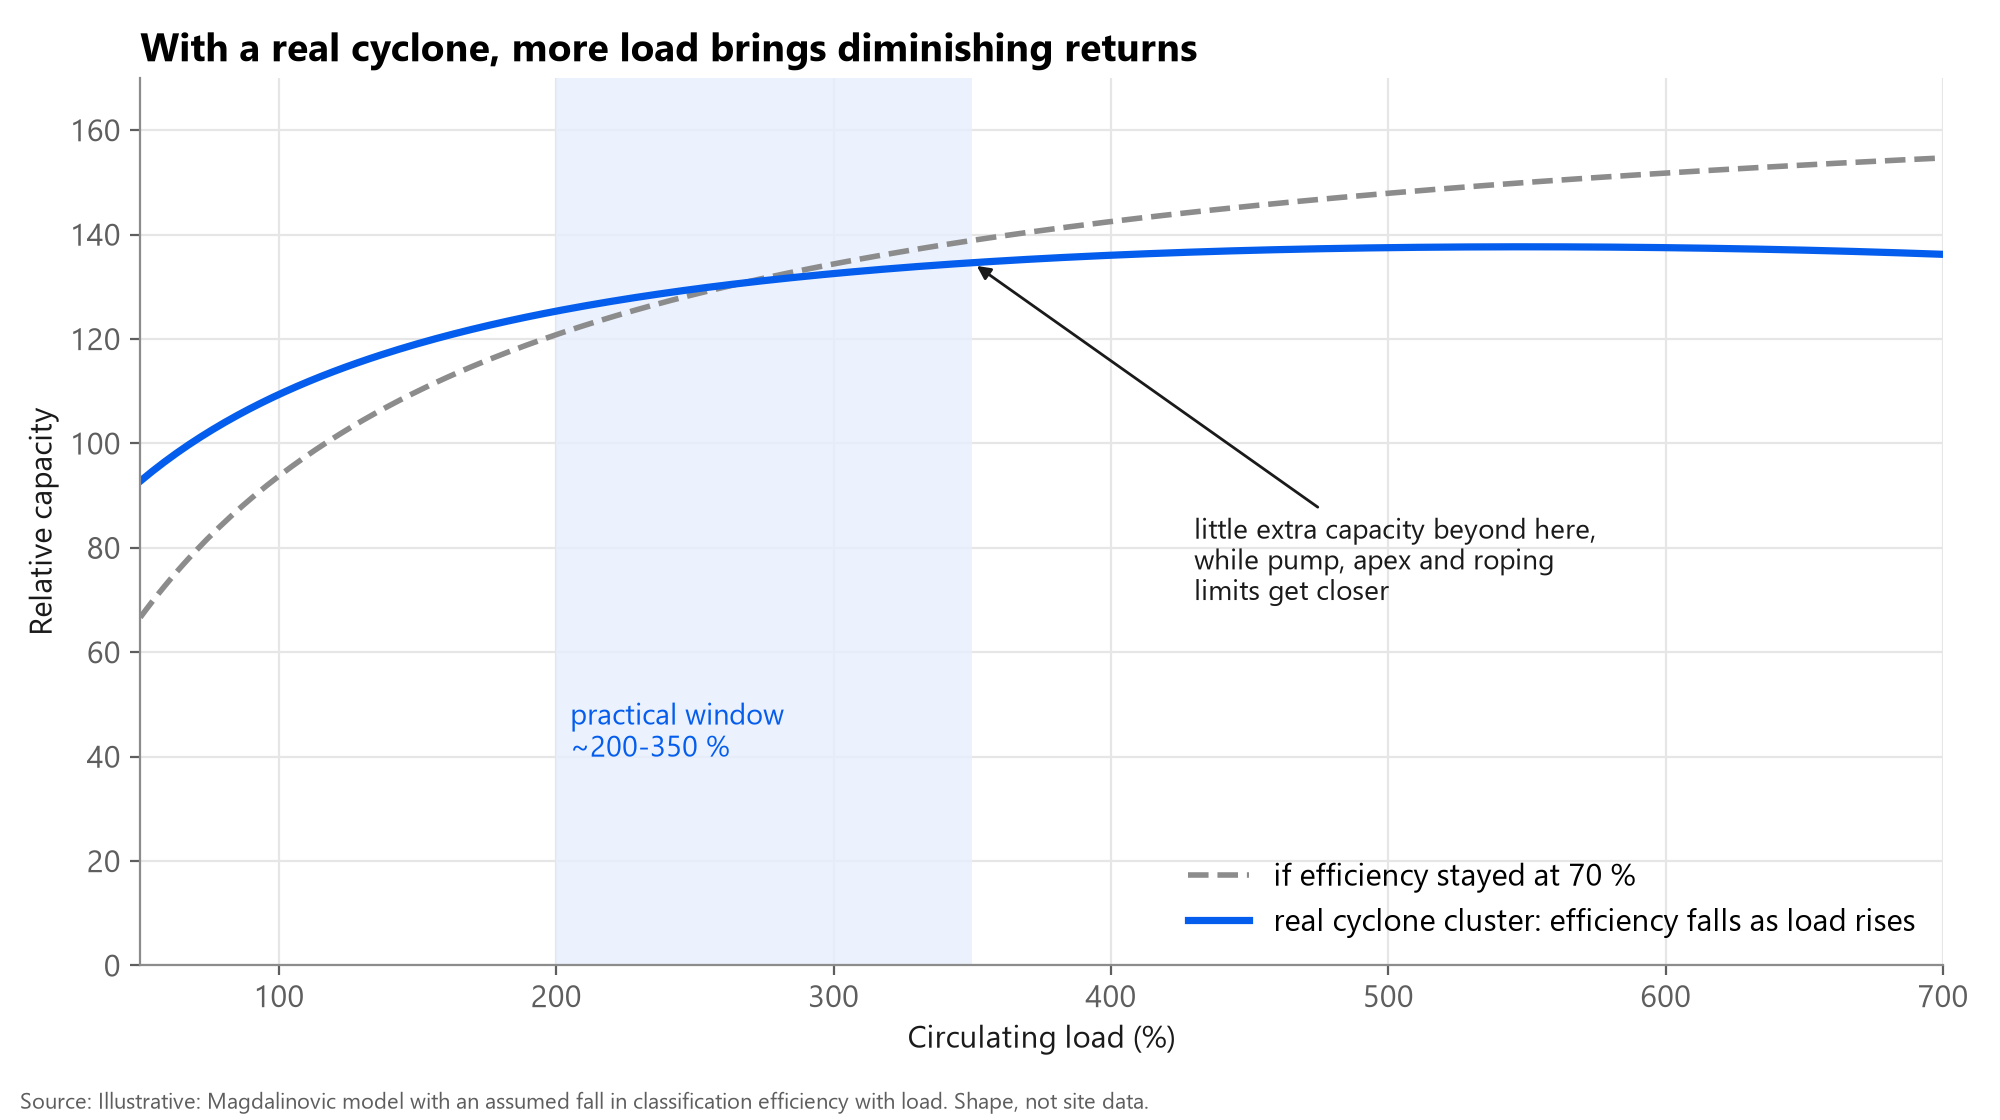
Load and efficiency are not independent. With a fixed cyclone cluster, a higher load means thicker, higher-flow cyclone feed, more bypass of fines to the underflow, and an apex approaching its capacity, so efficiency falls as load rises. Capacity flattens and the circuit approaches pump, apex and roping limits. Published experience puts the useful optimum near 250 % for conventional cyclones; with modern cyclones, enough pump capacity and lower feed density, 300-400 % can pay.
McIvor's three steps to raise classification system efficiency are: increase circulating load, reduce cyclone feed % solids, and use high-performance cyclones, engineered together with pump, piping and apex limits so the overflow size stays on target.
Measuring it in the plant: classification system efficiency (CSE)
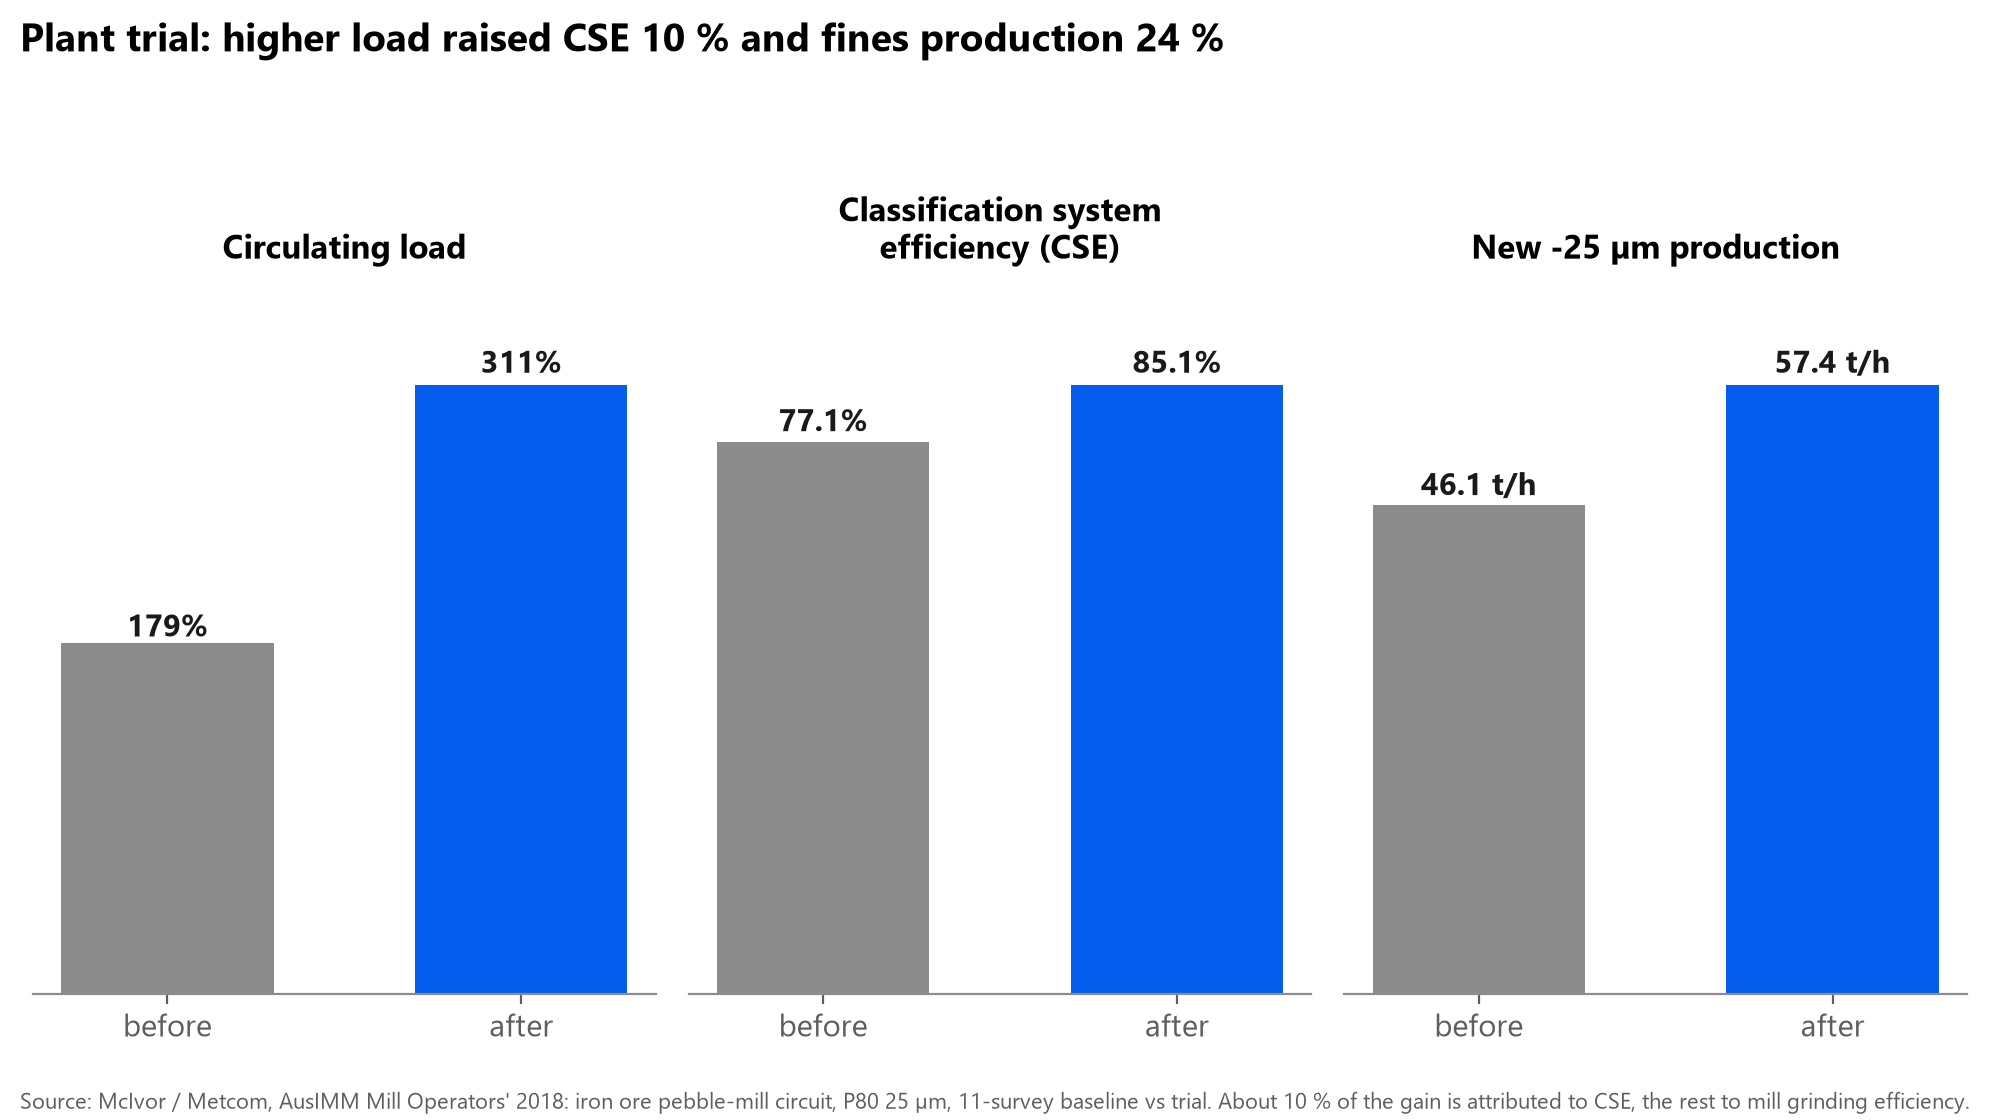
McIvor's functional performance equation writes ball mill circuit output of new product-size material as mill power x CSE x grindability x a mill grinding-rate ratio. CSE is the fraction of the mill contents coarser than the product size, estimated as the average of % coarse in mill feed and mill discharge. In Metcom's example, 80.7 % coarse in feed and 73.5 % in discharge give a CSE of 77.1 %: about 23 % of mill power goes into over-grinding fines.
In a plant trial on an iron-ore pebble-mill circuit (P80 25 µm), pump and cyclone changes raised circulating load from 179 % to 311 % at the same grind; CSE rose from 77.1 % to 85.1 % (10 % relative) and new -25 µm production from 46.1 to 57.4 t/h (24 %). Metcom attribute about 10 % to CSE and the rest to higher mill grinding efficiency measured in the same trial.
Key numbers
| Item | Value | Source |
|---|---|---|
| Bond design circulating load | 250 % | Bond; Jankovic et al. 2013 |
| Typical plant range | ~200-400 %; rarely <200 %, sometimes >700 % | Taggart via 911 Metallurgist |
| Capacity gain closing circuit at 200 % | ~2x (2.3x at 500 %) | Davis 1925 |
| Efficiency 50 -> 100 % at 250 % load | +45 % capacity (lab), +50 % (model) | Jankovic, Valery et al. 2013 |
| Load 250 -> 570 % at 50 % efficiency | +34 % (lab), +36 % (model) | Jankovic, Valery et al. 2013 |
| Plant trial CL 179 -> 311 % | CSE 77.1 -> 85.1 %, new fines +24 % | Metcom / McIvor 2018 |
| Screens replacing cyclones | ~20 % more grinding throughput (Saucito) | UQ / Newcrest |
Estimated ROI of ball mill capacity levers
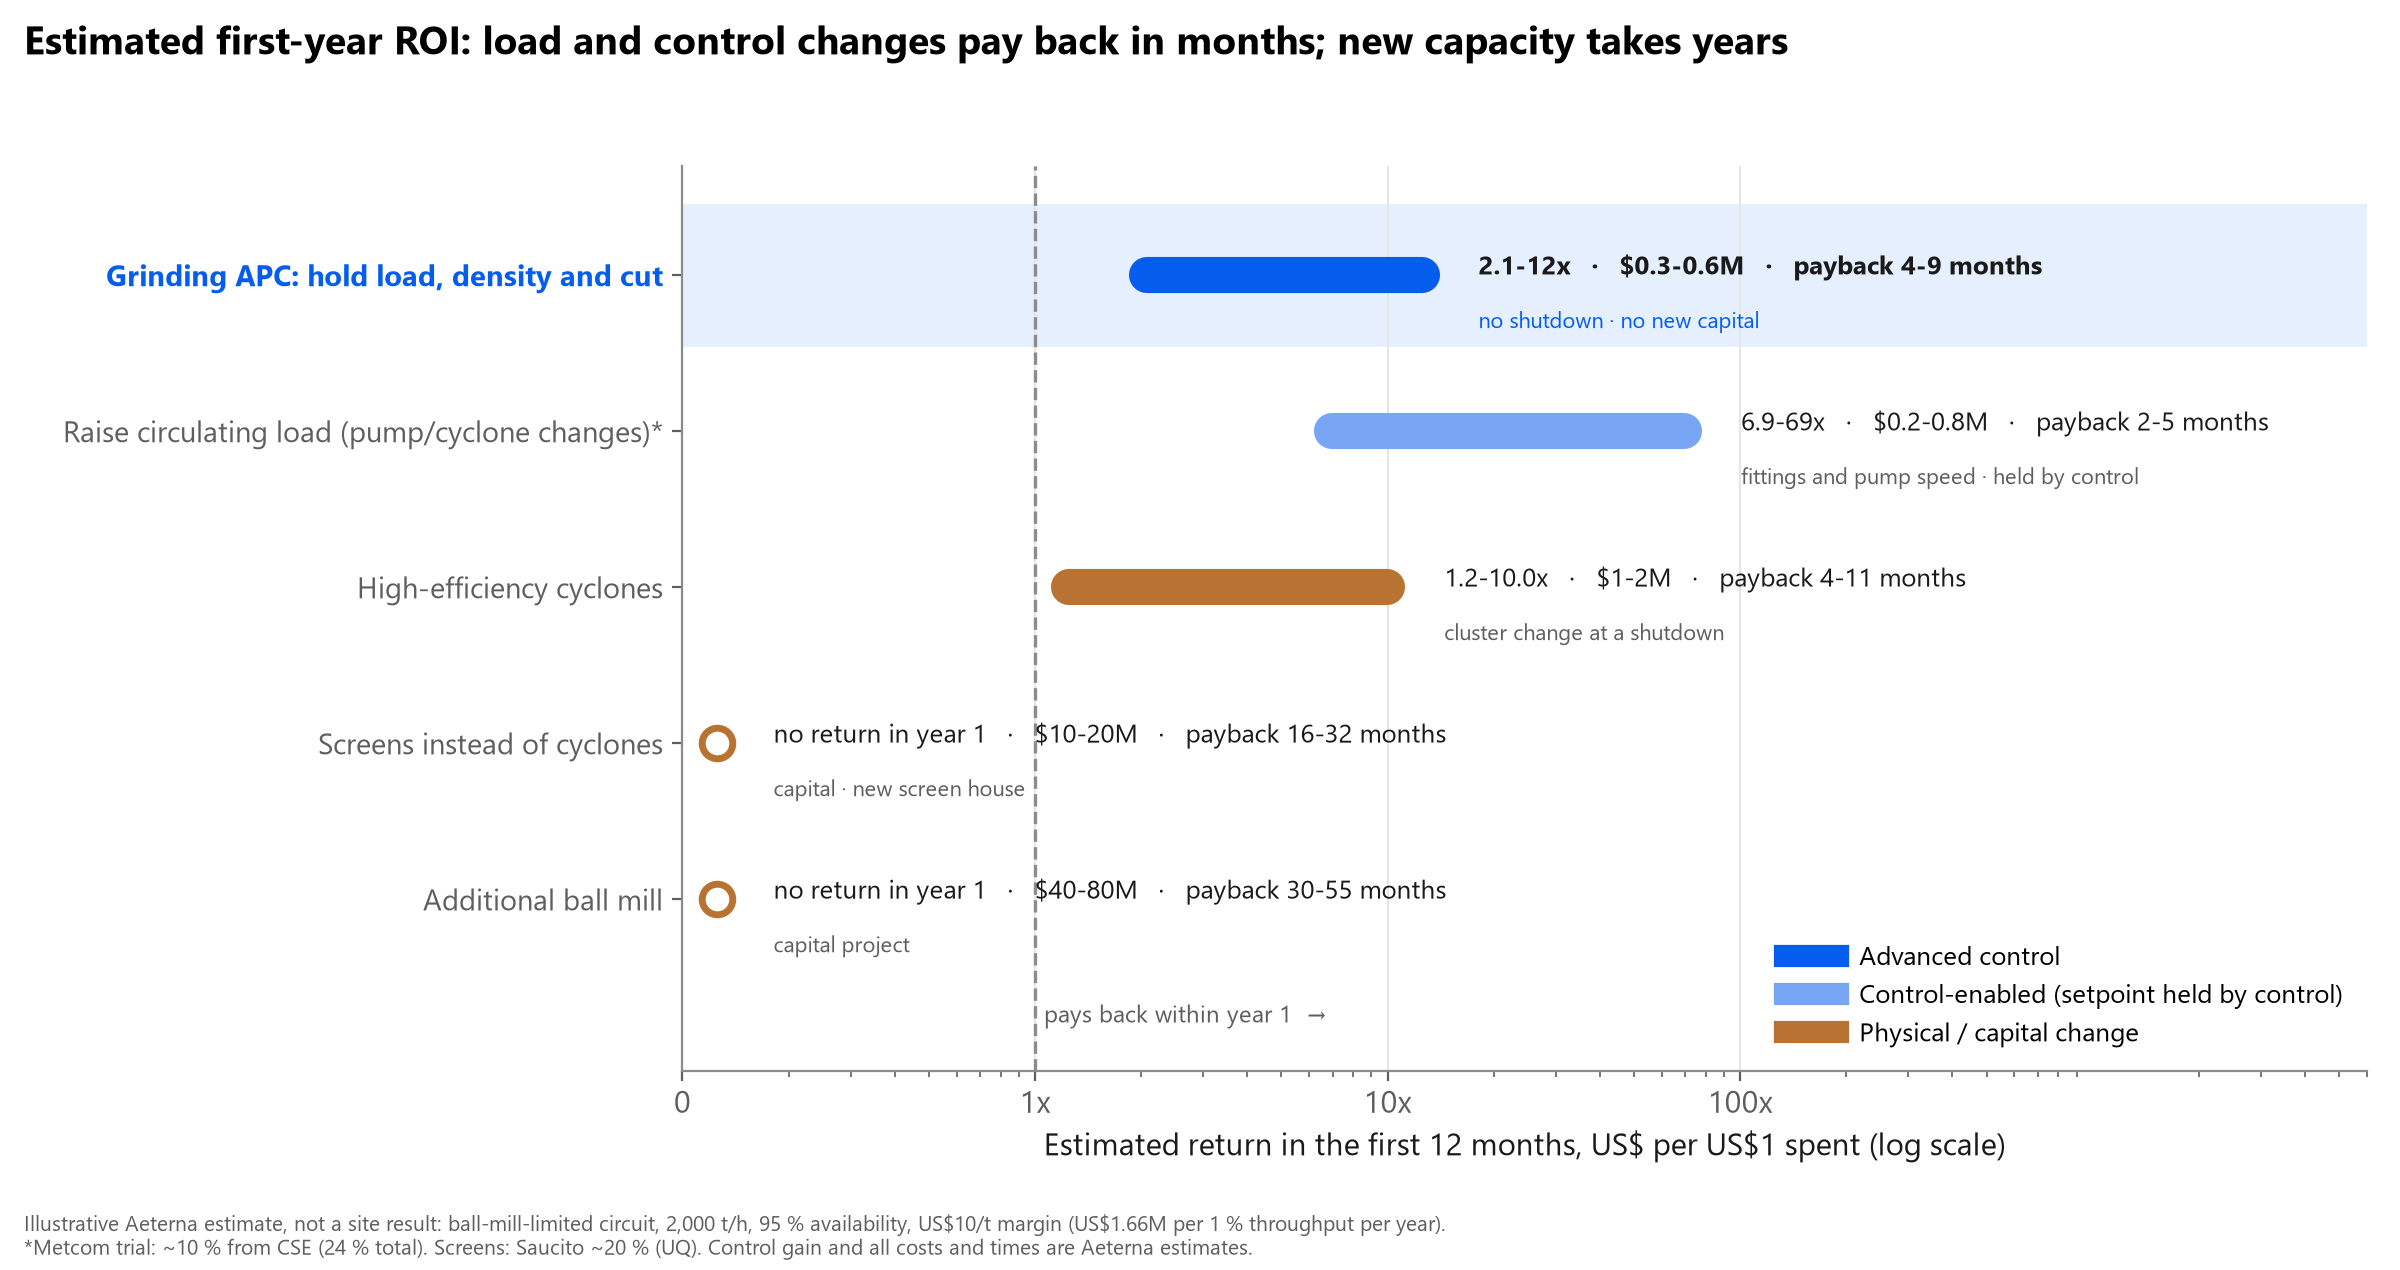
On an illustrative ball-mill-limited circuit (2,000 t/h, 95 % availability, US$10/t margin), 1 % throughput is worth about US$1.66M a year. Raising circulating load through pump-speed and cyclone-fitting changes (gain range anchored on Metcom's ~10 % from CSE) and holding it there with control is the highest-return option because it costs little. Grinding APC that holds load, cyclone density and cut returns roughly 2-12x in year one. High-efficiency cyclones pay back within a year; screens or an extra mill take years.
All costs and times are Aeterna estimates and include lost production for tie-ins; the APC gain range (1.5-3 %) is a conservative Aeterna assumption for a ball mill circuit.
| Lever | Gain | Est. cost incl. lost production | Time to value | Payback | Year-1 return |
|---|---|---|---|---|---|
| Grinding APC: hold load, density and cut | 1.5-3 % t/h | $0.3-0.6M | 3-6 months | 4-9 months | 2.1-12x |
| Raise circulating load (pump/cyclone changes)* | 5-10 % t/h | $0.2-0.8M | 2-4 months | 2-5 months | 6.9-69x |
| High-efficiency cyclones | 3-8 % t/h | $1-2M | 3-6 months | 4-11 months | 1.2-10.0x |
| Screens instead of cyclones | 10-20 % t/h | $10-20M | 12-18 months | 16-32 months | 0x |
| Additional ball mill | 30-50 % t/h | $40-80M | 24-36 months | 30-55 months | 0x |
Control and instrumentation angle
Circulating load drifts with ore hardness, cyclone wear and how many cyclones are open. Holding it needs a measured or inferred underflow rate (cyclone feed flow and density minus overflow), cyclone pressure, and sump level. A practical control layer manipulates sump water and pump speed to hold cyclone feed density and pressure, and adjusts the number of open cyclones, with an overflow size measurement (PSI) trimming the target.
For Aeterna: ProcessOpt can hold circulating load and cyclone feed density inside pump and apex limits while the SAG or feed controller sets throughput; the R-004 cyclone survey and a CSE calculation are the starting point of a grinding circuit review.
Common misconceptions
- 'Higher circulating load is always better.' Returns diminish, and efficiency falls as cyclones load up.
- 'Circulating load is a cyclone property.' It is set by the whole circuit: water, pump, cyclones open, ore and grind target.
- 'Bypass is harmless because fines leave next pass.' Fines in the mill take power and volume from coarse particles.
- '250 % is the optimum.' It is Bond's design basis; the right number depends on cyclone efficiency and pump limits.
Where sources disagree or are uncertain
- The Magdalinovic model under-predicts Davis's open-circuit comparison (1.83x vs 2.3x at 500 %); it is better relative to a closed-circuit baseline.
- Typical plant ranges are rarely published systematically; 200-400 % is common practice, not a standard.
- Metcom's 24 % gain combines CSE and grinding efficiency effects; only about 10 % is attributed to circulating load.
- Figure 3 is illustrative; the fall of efficiency with load is site-specific.
Ask for a grinding circuit review: one survey shows your circulating load, CSE and what they are worth.
Talk to an engineerSources
- Validation of a closed circuit ball mill model, Jankovic, Valery et al., Journal of Mining and Metallurgy 49A, 2013
- A guide to maximising ball mill circuit classification system efficiency (CSE), Metcom / McIvor, AusIMM Mill Operators' Conference, 2018
- Quickly and accurately determine your circulating load ratio, Metcom grinding bulletin
- Ball mill circulating load formula (Taggart ranges), 911 Metallurgist
- Energy efficient ball mill circuit - equipment sizing considerations, Jankovic & Valery, AusIMM MetPlant, 2013
- Effect of circulating load and classification efficiency on HPGR and ball mill capacity, OneMine
- The impact of classification on the energy efficiency of grinding circuits - the hidden opportunity, AusIMM Mill Operators' Conference, 2012
- Functional performance of ball milling circuits, AusIMM Mill Operators' Conference, 2014
- Poor classification costing the minerals industry significant revenue (Saucito screens), University of Queensland SMI, 2020