
Best Practice SAG Mill Operations
Keeping the mill in its sweet spot: load, motion, feed, media, discharge, relining and control
Why SAG operation deserves its own playbook
In most SAG-based concentrators the SAG mill is the throughput bottleneck and one of the largest single energy users on site. Small, sustained improvements here flow straight to production and to energy per tonne, which in turn means less energy and ore moved per unit of metal recovered.
SAG mills are harder to run than ball mills because the ore is part of the grinding media: changes in feed size, hardness and density change both the work to be done and the tools available to do it. Best practice is therefore about keeping the mill inside a moving operating window, not about fixed set-points.
The operating window: load, power and speed
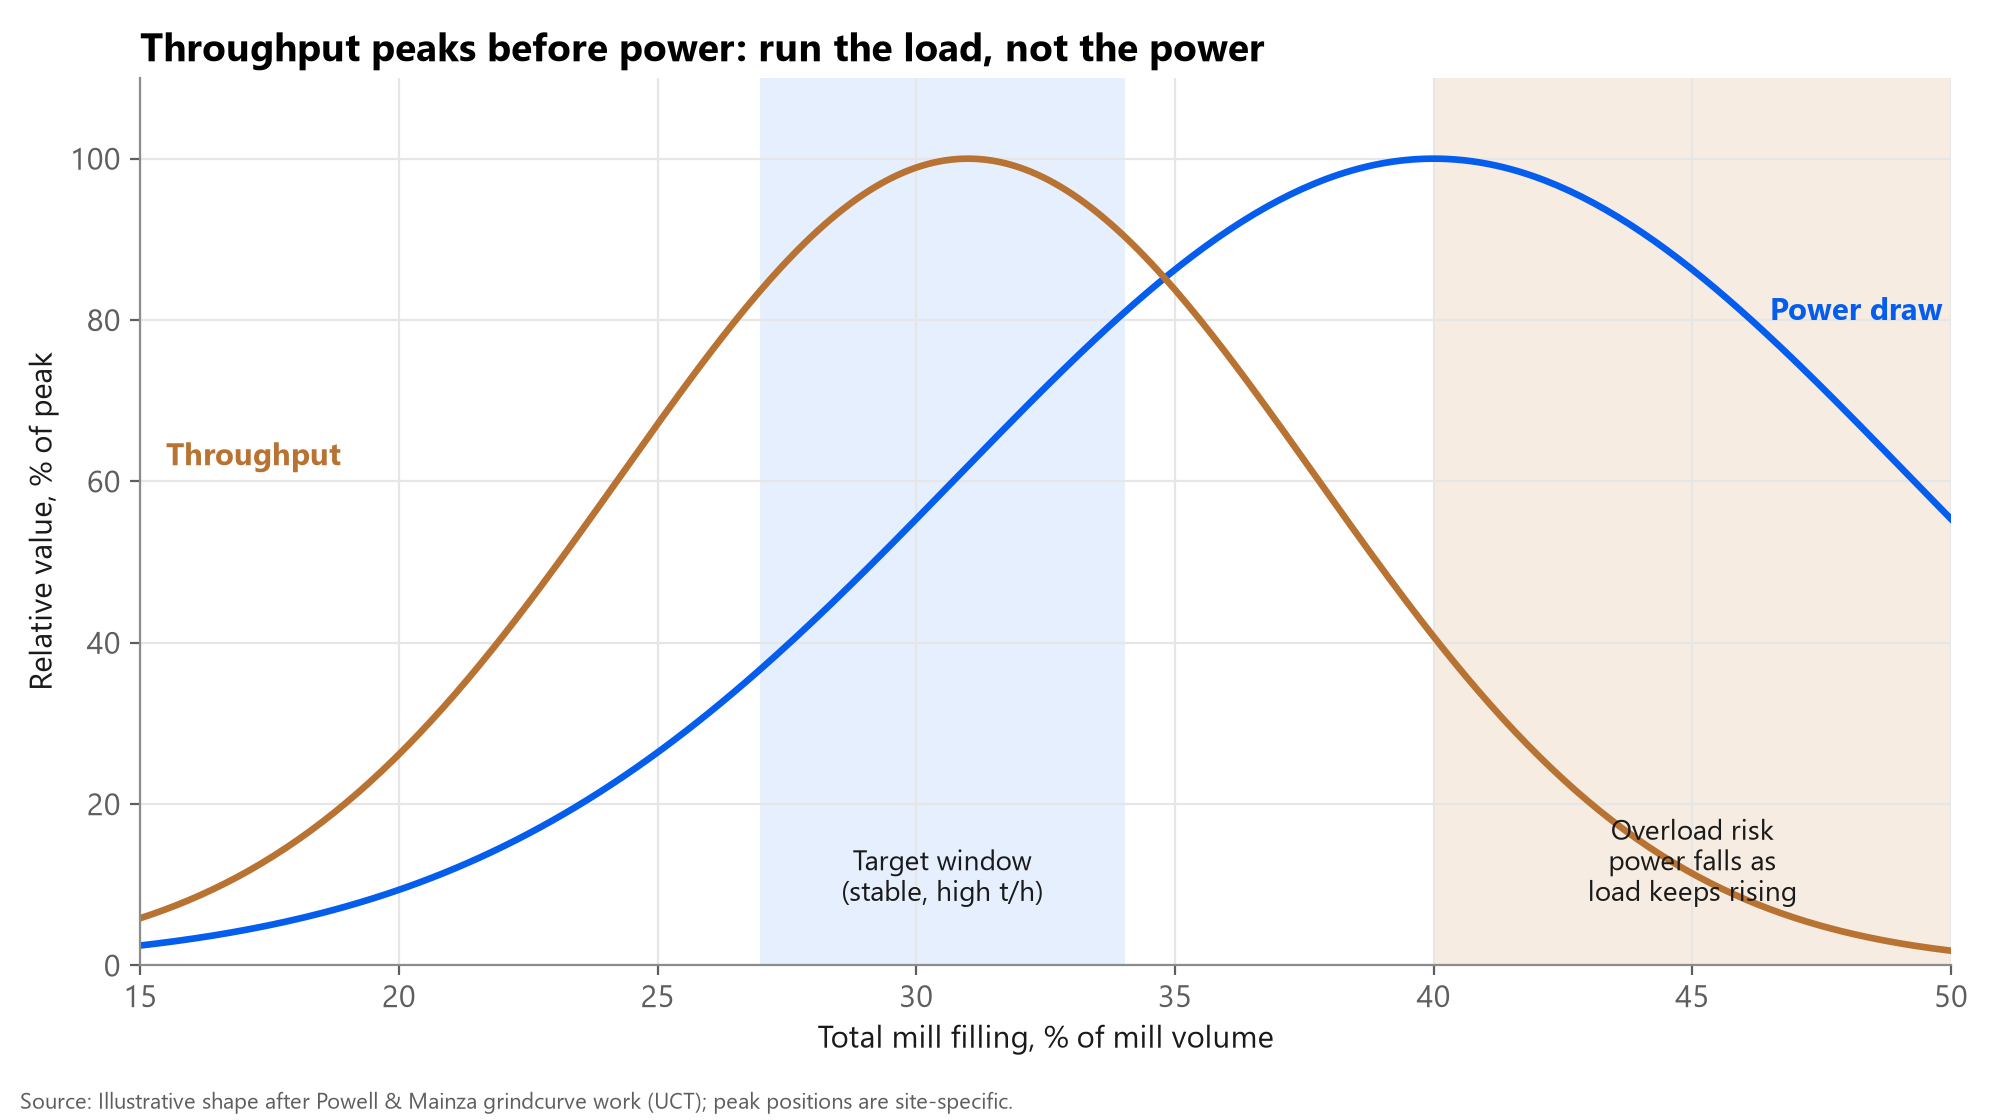
Grindcurve studies at the University of Cape Town showed that throughput, power draw and product size each peak at different mill fillings. Throughput typically peaks at a lower filling than power, so chasing maximum power can push a mill past its best throughput and toward overload. At South Deep, shifting the target filling using grindcurves was associated with a ~15 % throughput increase.
Typical SAG total fillings are reported around 28-35 % of mill volume. Beyond roughly 35-37 % many mills enter a region where power falls as load keeps rising - the classic overload signature. Because bearing pressure responds late, operators and controllers should watch power, load and sound together.
Mill speed sets the energy put into the charge and where the media lands. Reported operating speeds are mostly 68-80 % of critical, with new, tall lifters needing lower speed and worn liners needing more to keep the same trajectory.
- Overload signature: load or bearing pressure rising while power flattens or falls; mill sound becomes muffled. Response: reduce feed, check water, confirm discharge is not pooling.
- Pooling check: if power rises briefly when feed stops, slurry pooling (not rock overload) is likely.
- Underload / shell impact: low load, high acoustic impacts, power low. Response: raise feed or filling, or reduce speed.
Charge motion and liner protection
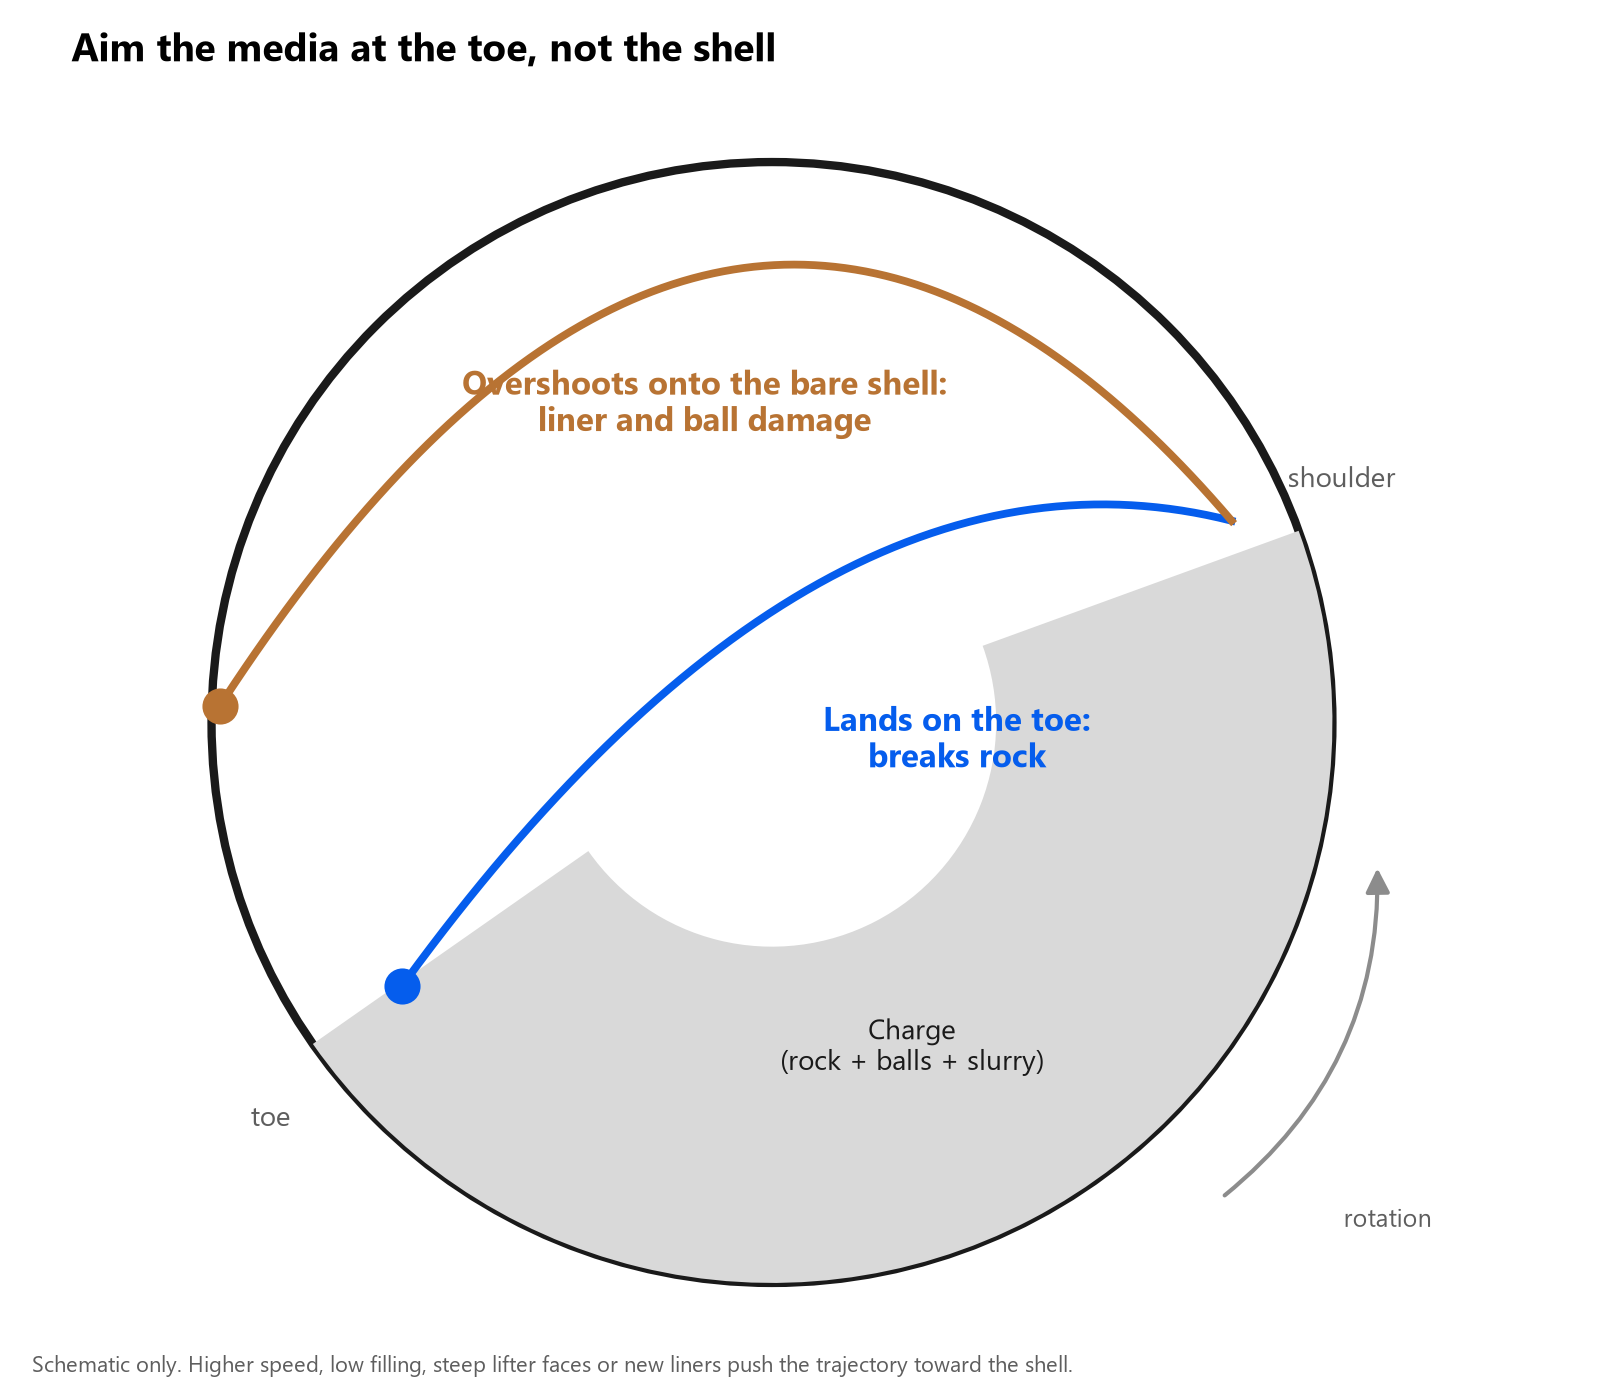
Ball impacts at the toe of the charge break rock; impacts on the bare shell above the toe damage liners and balls and waste energy. Liner wear rises roughly with the square of mill speed and with ball size, so speed is both a production and a maintenance lever.
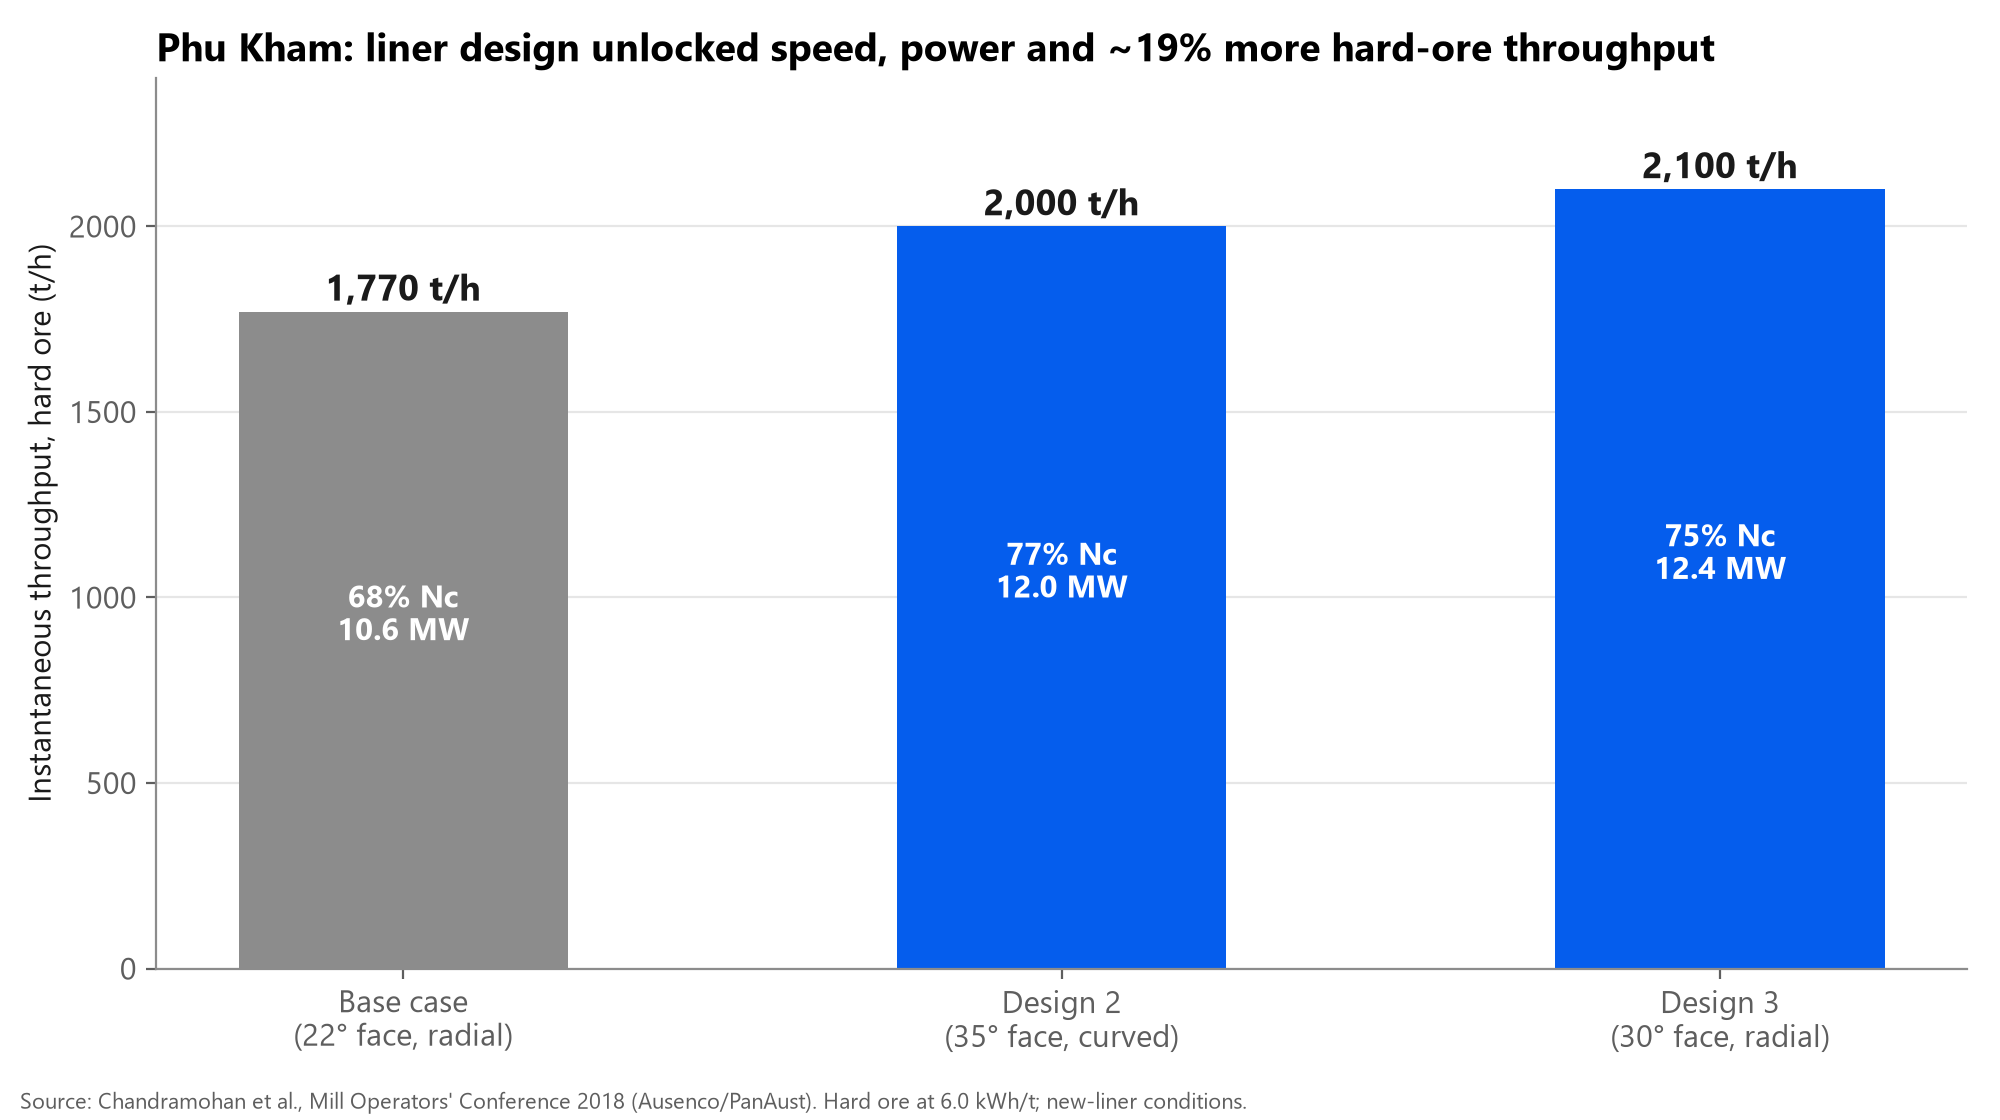
Phu Kham (34 ft x 18 ft, 13 MW SAG) tested several liner designs. The base liner forced the mill down to 68 % of critical to avoid shell impact (10.6 MW). Design 3 allowed 75 % of critical with 31 % total and 17 % ball filling, drawing 12.4 MW and lifting hard-ore capacity to ~2,100 t/h, within limits of 75 bar bearing pressure, 1,200 t total mass and 55 dB sound.
Acoustic or vibration sensing on the shell indicates whether media is hitting the shell. Many early impact-meter installations were never integrated into control, so the benefit was not realised - the measurement only pays when it drives speed and load decisions.
Phu Kham case: liner design, speed and filling together
| Item | Base case | Design 2 | Design 3 |
|---|---|---|---|
| Lifter face angle (deg) | 22 | 35 | 30 |
| Discharge | Radial | Curved | Radial |
| Grate open area / aperture | 14.5 % / 25 mm | 14.5 % / 25 mm | 15.6 % / 30 mm |
| Max speed, new install (% Nc) | 68 | 77 | 75 |
| Ball charge at start-up (% v/v) | 15 | 15 | 17 |
| Available power, new install (MW) | 10.6 | 12.0 | 12.4 |
| Instantaneous throughput, hard ore (t/h) | 1,770 | 2,000 | 2,100 |
Feed size, segregation and ore variability
For most SAG mills, finer feed performs better because steel balls do the work coarse rocks would do in an AG mill. Cadia Hill reported 10-15 % more throughput when F80 fell from ~92 mm to ~70 mm; mine-to-mill blasting changes have been linked to throughput gains of up to ~20 %.
Stockpile segregation is a hidden driver: coarse rocks roll to the outside of the pile and report to feeders as it draws down. Two feeds with almost identical F80 have shown ~50 % different throughput because the fines tail differed - F80 alone can mislead.
Ore density and hardness changes also disturb the mill. At Phu Kham, adding an inferred ore SG signal to the controller improved its response to transitions from friable to competent ore.
- Blend feeders deliberately to hold a consistent size distribution.
- Track the full size distribution (including fines), not just F80.
- Feed ore information forward to the mill controller instead of waiting for load to react.
Water, density and discharge
Discharge density of ~70-72 % solids is a common starting point; lower densities (<65 %) favour throughput on hard ore and higher densities (~75 %) a finer grind, with clay-rich ores at risk of packing between lifters at high density. The right value is ore-specific and should be set from plant tests.
Grates and pulp lifters set the mill's slurry capacity. Insufficient discharge causes slurry pooling, which cushions impacts and cuts power and throughput; Phu Kham's model showed ~12.3 MW without pooling at 14 % grate open area versus ~11.6 MW with pooling at 5 %. Too much open area or radial lifters at high speed can increase flowback.
Grinding media and ball charge
Ball charge supplies most of the impact energy. Larger balls break coarse rock better but are harder on liners; balls above ~125 mm are rarely justified, and sites that pre-crush SAG feed should revisit both top-up ball size and liner design.
Media quality matters: at Navachab, 30 t of worn, irregular ball scats (43 % of the ball charge) were removed and throughput rose by ~11 %, with lower specific energy. Competent media and scats removal (via pebble ports where available) are low-cost levers.
Pebble handling and critical size
Critical-size material (roughly 25-60 mm) is too small to break other rocks and too large to be broken efficiently; when it accumulates it can sharply reduce throughput. Recycle (pebble) crushing is commonly reported to raise SAG throughput by 15-30 %.
Results depend on pebble port extraction capacity and pebble crusher availability (Chino reported only 69 % availability). At Telfer, pebble crusher CSS alone moved plant throughput by 2.2-2.6 %; at Cadia, full pebble crushing lifted SAG throughput from ~2,040 to ~2,150 t/h versus average operation.
Relining and availability
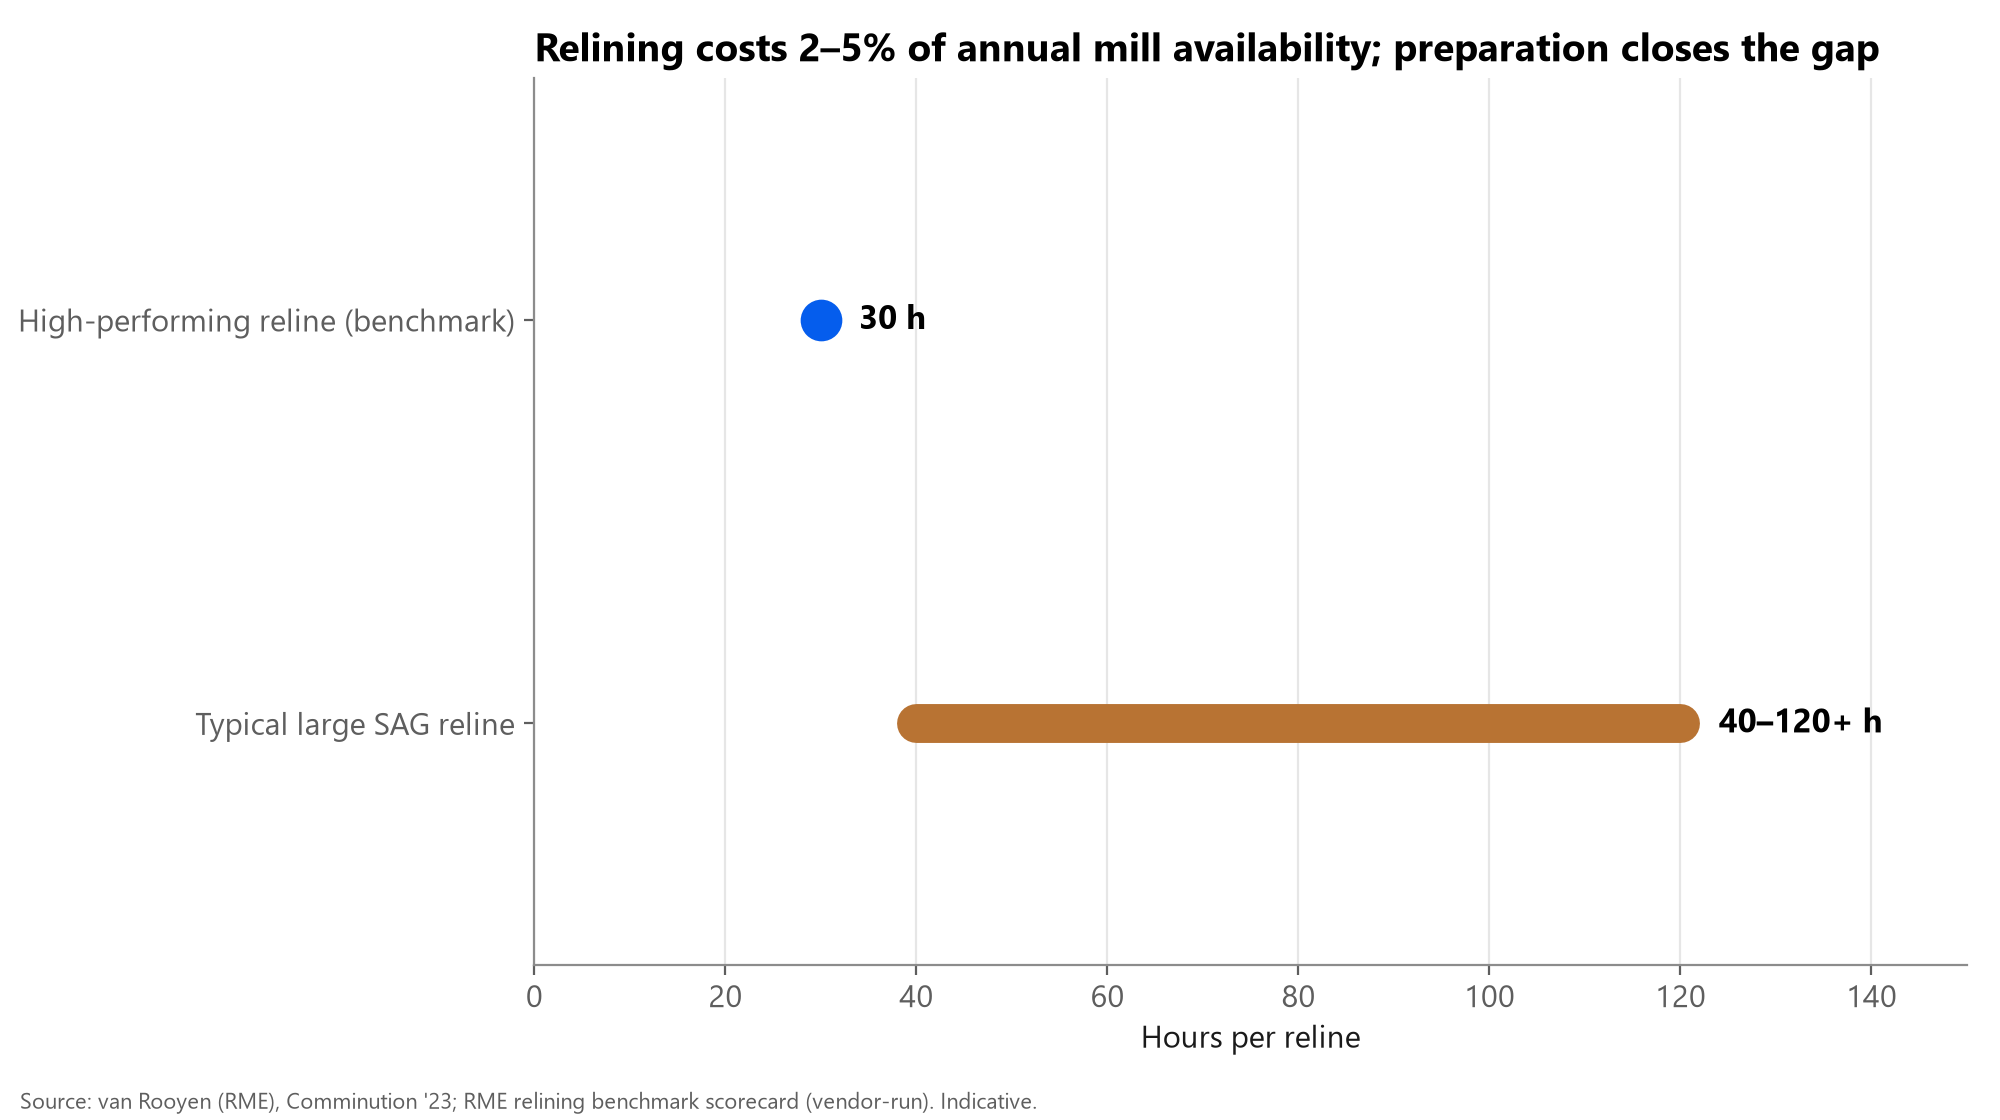
Relines typically cost 2-5 % of annual mill availability, sometimes more. Reline durations for large SAG mills range from about 40 to 120+ hours depending on liner condition, tooling and crew experience, while a high-performing benchmark is ~30 hours for a high-wear reline on a medium-large mill (vendor-run benchmark).
Liner design affects both life and capacity: the Cadia shell-liner redesign extended life from ~120 to ~143 days at change-out. Planning practice - right-sized liner handler, pre-staged liners, knock-in preparation (15-25 % of reline time), bolt tooling - is where hours are won.
Control strategy
SAG control is fundamentally load (weight or bearing pressure) control with power, sound and bearing-pressure constraints, using feed rate, water and (where available) speed as handles. Common causes of poor SAG control are weak base loops (especially feed-rate control), slow integrating loops mistuned, poor instruments and lack of metallurgical input.
Supervisory layers - expert systems, fuzzy logic and MPC - add value once the base layer is sound. Reported gains: ~1.5-2 % throughput from MPC over existing expert systems at three sites with >50 % lower variability in feed, power and noise at one; ~1.8 % throughput and 3 % lower power with a fuzzy expert controller at Sungun. A named metallurgical champion and a process-control audit before implementation are recommended.
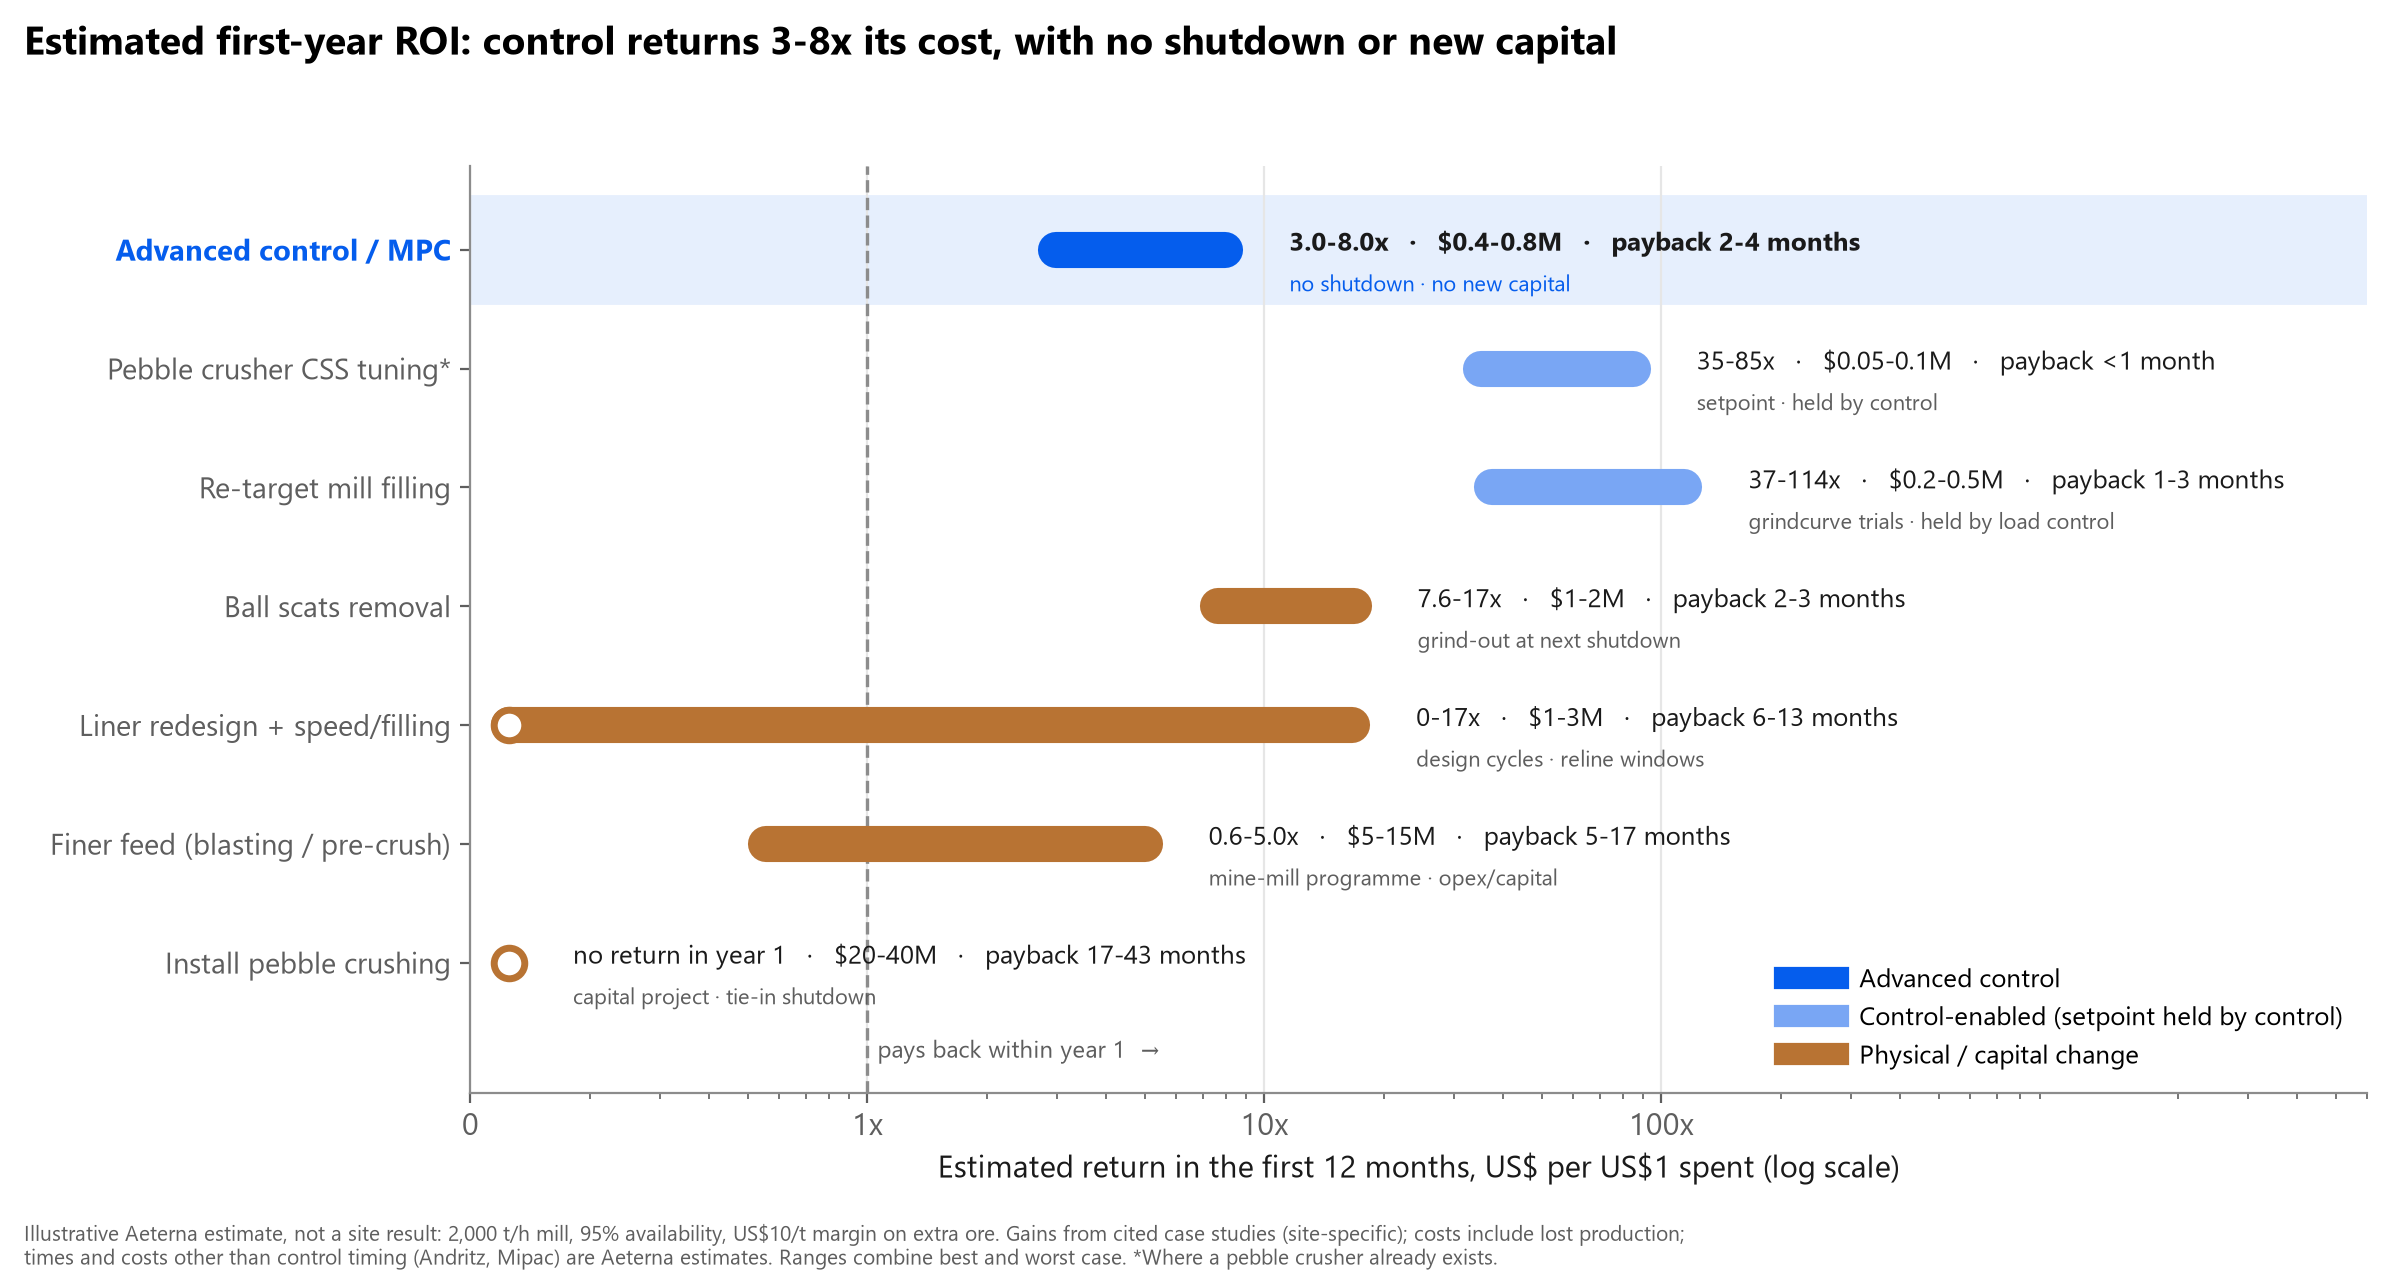
Estimated return on investment
Comparing levers on percentage gain alone is misleading, because the levers differ by orders of magnitude in cost and time to value. We therefore estimate a first-year return for each lever on a reference mill (2,000 t/h, 95 % availability, US$10/t margin on extra ore, so each 1 % of throughput is worth about US$1.7M a year). Cost includes lost production during shutdowns; return only starts once the lever is in place. These are illustrative Aeterna estimates, not site results.
On that basis advanced control returns roughly 3-8x its cost in the first year and pays back in 2-4 months, with no shutdown and no new capital. Setpoint changes that control holds in place - re-targeting mill filling, tuning an existing pebble crusher - return the most of all. Ball scats removal also scores well where scats are the problem. Liner redesign, finer feed and new pebble crushing give larger steps, but much of their first year goes to design, procurement and shutdowns, so payback runs from 6 to 43 months.
Control also makes the other levers stick. Re-targeting mill filling only holds if a controller keeps the load at the new target; at Phu Kham the new liners delivered their capacity once the controller was given an inferred ore SG signal to handle ore changes. In practice the sequence that works is: stabilise with control first, then lift the ceiling with physical changes, and let the controller hold the new operating point.
Illustration of scale: on a 2,000 t/h SAG mill at 95 % availability, a 1.5 % gain is about 30 t/h, or roughly 250,000 t of additional ore a year, from a change that needs no shutdown.
| Lever | Reported gain | Est. cost (incl. lost production) | Time to value | Payback | Year-1 return per $1 |
|---|---|---|---|---|---|
| Advanced control / MPC | 1.5-2 % | $0.4-0.8M | 1-2 weeks | 2-4 months | 3.0-8.0x |
| Pebble crusher CSS tuning* | 2.2-2.6 % | $0.05-0.1M | 1-2 weeks | <1 month | 35-85x |
| Re-target mill filling | 15 % | $0.2-0.5M | 1-3 months | 1-3 months | 37-114x |
| Ball scats removal | 11 % | $1-2M | 1-2 months | 2-3 months | 7.6-17x |
| Liner redesign + speed/filling | 19-20 % | $1-3M | 6-12 months | 6-13 months | 0-17x |
| Finer feed (blasting / pre-crush) | 10-20 % | $5-15M | 3-6 months | 5-17 months | 0.6-5.0x |
| Install pebble crushing | 15-30 % | $20-40M | 12-24 months | 17-43 months | none in year 1 |
Typical operating ranges
| Variable | Reported range / practice | Why it matters | Source |
|---|---|---|---|
| Total filling (load) | ~28-35 % v/v typical; overload often above ~35-37 % (site-specific) | Throughput peaks before power | 911 Metallurgist; Phu Kham; grindcurve work |
| Ball charge | ~10-17 % v/v common (2-22 % reported) | Sets impact energy and power | Phu Kham; SAG design literature |
| Mill speed | ~68-80 % of critical; new liners lower, worn liners higher | Trajectory: toe vs shell | Phu Kham; liner design papers |
| Top-up ball size | <= ~125 mm rarely exceeded with benefit; smaller after pre-crushing | Liner damage vs coarse breakage | Powell; Mwansa et al. 2025 |
| Discharge density | ~65-75 % solids; ~70-72 % common starting point | Grind vs throughput; packing with clays | 911 Metallurgist forum; plant guides |
| Grate open area | ~14-16 % (Phu Kham); too high -> flowback | Slurry pooling vs flowback | Phu Kham; slurry pooling studies |
| Availability (design) | up to ~95 % | Relines cost 2-5 % a year | van Rooyen (RME) 2023 |
KPIs for a SAG mill
| KPI | What it tells you | Typical cadence |
|---|---|---|
| Throughput (t/h) and specific energy (kWh/t) by ore type | Is the mill using its power well for the ore it gets? | Shift / daily |
| Mill load (weight or bearing pressure) vs target | Stability of the operating point | Real time; daily variance |
| Time in overload / underload | How often the mill leaves its window | Daily |
| Shell impacts (acoustic) per hour | Liner and media protection | Real time |
| Feed size (F80 and fines fraction) and ore SG | Explains throughput swings before they happen | Real time / hourly |
| Pebble crusher availability and pebble rate | Is critical size being removed? | Daily |
| Liner life (days, t) and reline hours | Availability and cost per tonne | Per reline |
| Control utilisation (% time in auto) | Is the control layer actually helping? | Daily / monthly review |
Where sources disagree
- Overload symptom: most control literature describes power falling while load rises; some general guides describe rising amperage. Plant data should define the local signature.
- Where the power peak sits: ~35-37 % filling in some references vs ~45-50 % reported at South Deep - peak position depends on speed, liner and ore.
- Coarse rocks in feed: Cadia and most SAG work favour finer feed, while one study found throughput improved as the >200 mm fraction rose from 10 % to 30 % (and fell beyond 45 %). Competent coarse rock can act as media in some ores.
- Role of lifters: commonly described as lifting media for toe impact, while one liner study argues lifters mainly protect the liner rather than drive breakage.
Instrumentation and Aeterna angle
The recurring theme in the case studies is information arriving late: feed size, hardness and SG changes show up in the mill load after the fact, and shell impacts are heard before they are measured. Continuous rock-size measurement on the SAG feed belt, shell-signature monitoring and an MPC that uses both give the controller and the operator a head start.
Keep claims humble: the literature supports a few percent from better control on top of a well-run mill, with larger gains coming from physical changes (liners, media, pebble crushing, feed preparation) that good measurement helps identify and sustain.
Want to see where your SAG mill sits in its window? Ask us about a grinding circuit review.
Talk to an engineerSources
- SAG Mill Optimisation and Increasing Throughput at the Phu Kham Copper-Gold Operation, Chandramohan, Braun, Lane, Hollis, Le, Baas - Mill Operators' Conference (AusIMM), 2018
- Startling effect of ball scats removal on SAG mill performance, M. Powell (UCT) & I. Smit (AngloGold)
- Model predictive control of SAG mills and flotation circuits, M.G. Forbes & W.A. Gough, ANDRITZ Automation
- SAG mill optimization using model predictive control, W.A. Gough, ANDRITZ
- A practical guide to SAG Mill Management, Mipac, 2025
- Optimisation of the Cadia Hill SAG mill circuit, SMC Testing (mine-to-mill documents)
- Milling curves as a tool for characterising SAG mill performance, Powell, Mainza et al. (UCT)
- Applying grinding curves to mill operation and optimisation, Powell et al. (UCT)
- Influence of feed size on AG/SAG mill performance, ResearchGate
- The influence of feed size on AG and SAG grinding and the role of blasting, SMC Testing
- Optimising SAG mill throughput and circulating load using machine learning models, Minerals Engineering (Elsevier), 2025
- Slurry pooling and transport issues in SAG mills, ResearchGate
- Common operational issues on SAG mill circuits, M. Powell (copy on Scribd)
- Semi-autogenous grinding (SAG) mill liner design and development, ResearchGate
- Revising top-up ball size and liner design post pre-crushing, Mwansa et al., Comminution '25 (MEI), 2025
- Designing grinding plants for mill relining to maximise mill availability, van Rooyen (RME), Comminution '23 (MEI), 2023
- Mill Relining Benchmarking Scorecard, RME
- Supervisory fuzzy expert controller for SAG mill grinding circuits: Sungun copper concentrator, ResearchGate
- Evolution of SAG mill process control at the Xstrata Nickel Raglan plant, WipWare (paper)
- Pebble crushing by HPGR, F.P. van der Meer, Weir Minerals (CEEC)
- Incorporation of pebble crusher specific energy measurements for SABC optimisation at Telfer, AusIMM Mill Operators' Conference, 2009
- Optimum SAG mill discharge density (discussion), 911 Metallurgist
- The control of autogenous and semi-autogenous mills, Journal of the SAIMM, vol. 80 no. 11, 1980
- AG & SAG mill grinding circuit automatic control, 911 Metallurgist
- The impactmeter: monitoring and avoiding harmful high-energy impacts on SAG liners, academia.edu