
Ball Mill Fundamentals: Bond Work Index, Critical Speed and Media Size
Three numbers that size a ball mill: how hard the ore is, how fast the shell turns, and how big the balls are
Why ball mill fundamentals still matter
The ball mill is usually the largest single energy user in a concentrator. A 2021 review of more than 40 studies, commissioned by Weir and led by CEEC's director, put comminution at about 25-27 % of final energy at an average copper, gold, iron ore, nickel or lithium mine, and well above that on some sites. Napier-Munn (2015) cautions that these shares are hard to measure, but the direction is clear: small changes in grind energy are large in absolute terms.
The three topics in this brief are the ones every metallurgist inherits from Fred Bond's work in the 1950s: how much energy the ore needs (work index), how fast the mill should turn (critical speed) and how big the grinding media should be (top ball size). They are still the starting point for mill design, and the yardstick for judging whether an operating circuit is efficient.
Bond's third law in plain terms
Bond proposed in 1952 that the energy to break rock is proportional to the new crack length created, which works out as proportional to 1/sqrt(size). In practice this gives the familiar equation W = 10 Wi (1/sqrt(P80) - 1/sqrt(F80)), where F80 and P80 are the 80 % passing sizes of feed and product in microns, W is specific energy in kWh/t and Wi is the work index in kWh/t.
The work index has a physical meaning: it is the energy needed to grind one tonne from a theoretically infinite size to 80 % passing 100 µm. Put P80 = 100 µm and F80 = infinity into the equation and W = Wi.
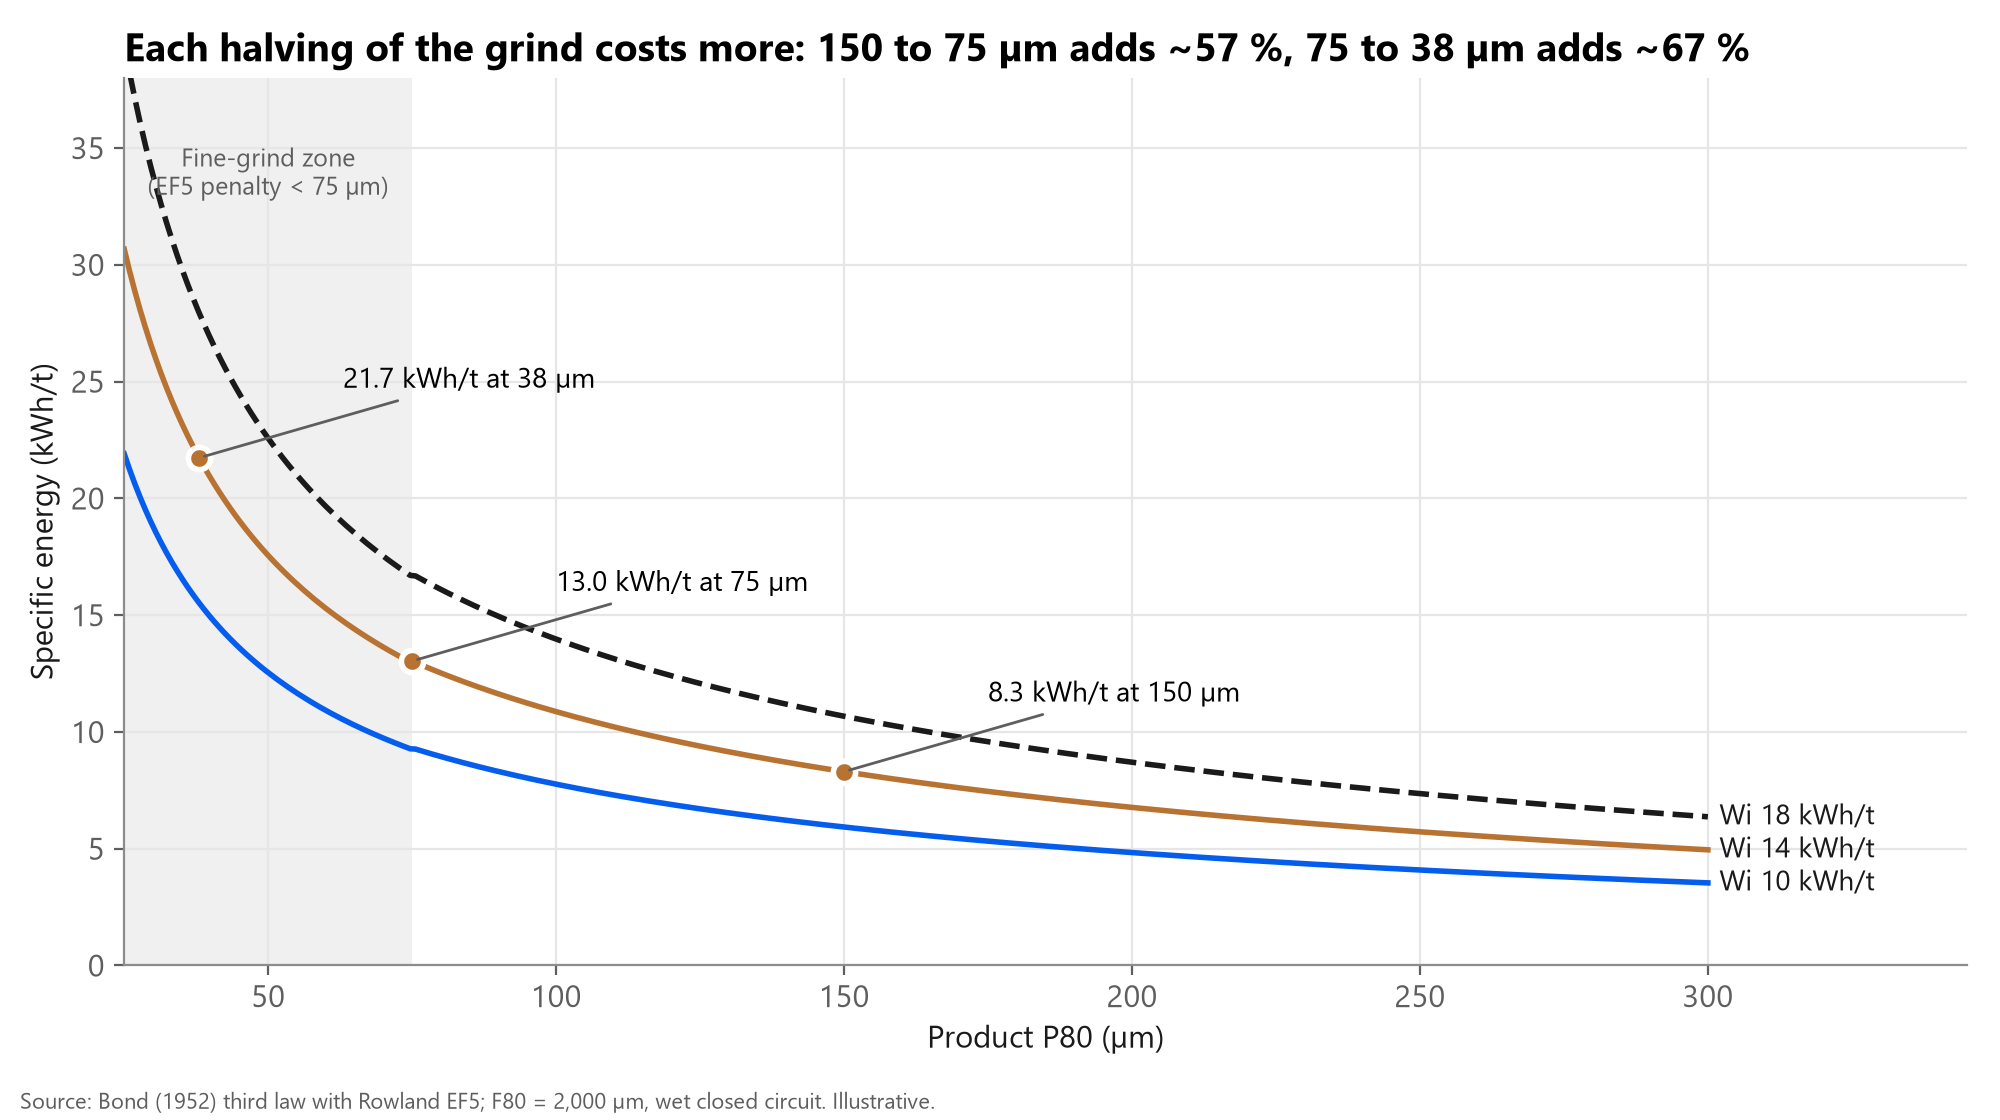
Because the product term is 1/sqrt(P80), most of the energy is spent at the fine end. Halving the grind from 150 to 75 µm adds about 57 % to the energy, and halving again to 38 µm adds a further ~67 % once the fine-grinding correction applies. That is why grind-size targets deserve a metallurgical justification, not a habit.
From the lab test to the motor: work index and efficiency factors
The ball mill work index is measured with the Bond grindability test: a 305 x 305 mm laboratory mill grinds 700 cc of dry, packed ore (typically minus 3.35 mm) in locked cycles at a simulated 250 % circulating load until the net grams of undersize per revolution stabilise. The test takes roughly 5-6 hours per sample, which is why many projects also use faster comparative tests for variability.
Bond's equation describes a reference mill: wet, closed circuit, 2.44 m diameter, with a sensible feed size. Rowland's efficiency factors correct for everything else; their product multiplies the Bond energy to give the expected pinion energy of a real mill.
Worked example (illustrative): a 5.5 m ball mill treats 500 t/h of 14 kWh/t ore from F80 2,000 µm to P80 150 µm. Bond gives 8.30 kWh/t; EF3 for a mill above 3.81 m is 0.914, so W = 7.6 kWh/t and the mill needs about 3.8 MW at the pinion. Grinding the same ore to 75 µm would need about 6.0 MW.
Operating sites can turn the equation around: the operating work index Wio = W / (10 (1/sqrt(P80) - 1/sqrt(F80))), using measured power and surveyed sizes, compared with the lab Wi, gives a quick efficiency check (Rowland 1999). A ratio of lab to operating Wi above 100 % means the circuit is doing better than Bond's average.
| Factor | Corrects for | Value / formula | Comment |
|---|---|---|---|
| EF1 | Dry grinding | 1.3 dry; 1.0 wet | Dry mills need ~30 % more energy |
| EF2 | Open-circuit ball mill | 1.035 (50 % passing control size) to 1.70 (98 %) | Closed circuit = 1.0 |
| EF3 | Mill diameter | (2.44 / D)^0.2 for D < 3.81 m; 0.914 above | Large mills ~9 % more efficient than the 2.44 m reference |
| EF4 | Oversize feed | >1 when F80 > F0 = 4,000 x sqrt(14.3 / Wi) µm | Penalises feed too coarse for the ball size |
| EF5 | Fine grind | (P80 + 10.3) / (1.145 P80) for P80 < 75 µm | 1.11 at 38 µm, 1.30 at 20 µm |
| EF7 | Low reduction ratio | >1 when F80 / P80 < 6 | Regrind duty with little size reduction |
Typical work index values
Bond's own compilation, still reproduced in handbooks, shows most metal ores between about 10 and 16 kWh/t. The averages hide wide ranges: individual copper and gold ore samples run from below 8 to above 20 kWh/t, and a single orebody can swing by several kWh/t from one domain to the next.
Note on units: Bond's original tables were in kWh per short ton, and secondary sources do not always state whether they have converted (multiply by 1.102 for metric tonnes). Treat tabulated values as indicative and always test the actual ore.
| Material | Average Wi (kWh/t, as tabulated) | Number of tests |
|---|---|---|
| Limestone | 9.9 | 177 |
| Granite | 9.9 | 8 |
| Zinc ore | 10.9 | 9 |
| Quartzite | 11.2 | 13 |
| Taconite | 12.0 | 20 |
| Iron ore (unspecified) | 12.4 | 118 |
| Lead-zinc ore | 12.5 | 58 |
| Nickel ore | 12.5 | 39 |
| Copper ore | 12.8 | 769 |
| Magnetite | 13.2 | 73 |
| Bauxite | 14.5 | 29 |
| Gold ore | 14.6 | 183 |
| Silica sand | 16.0 | n/a |
Critical speed and how the charge moves
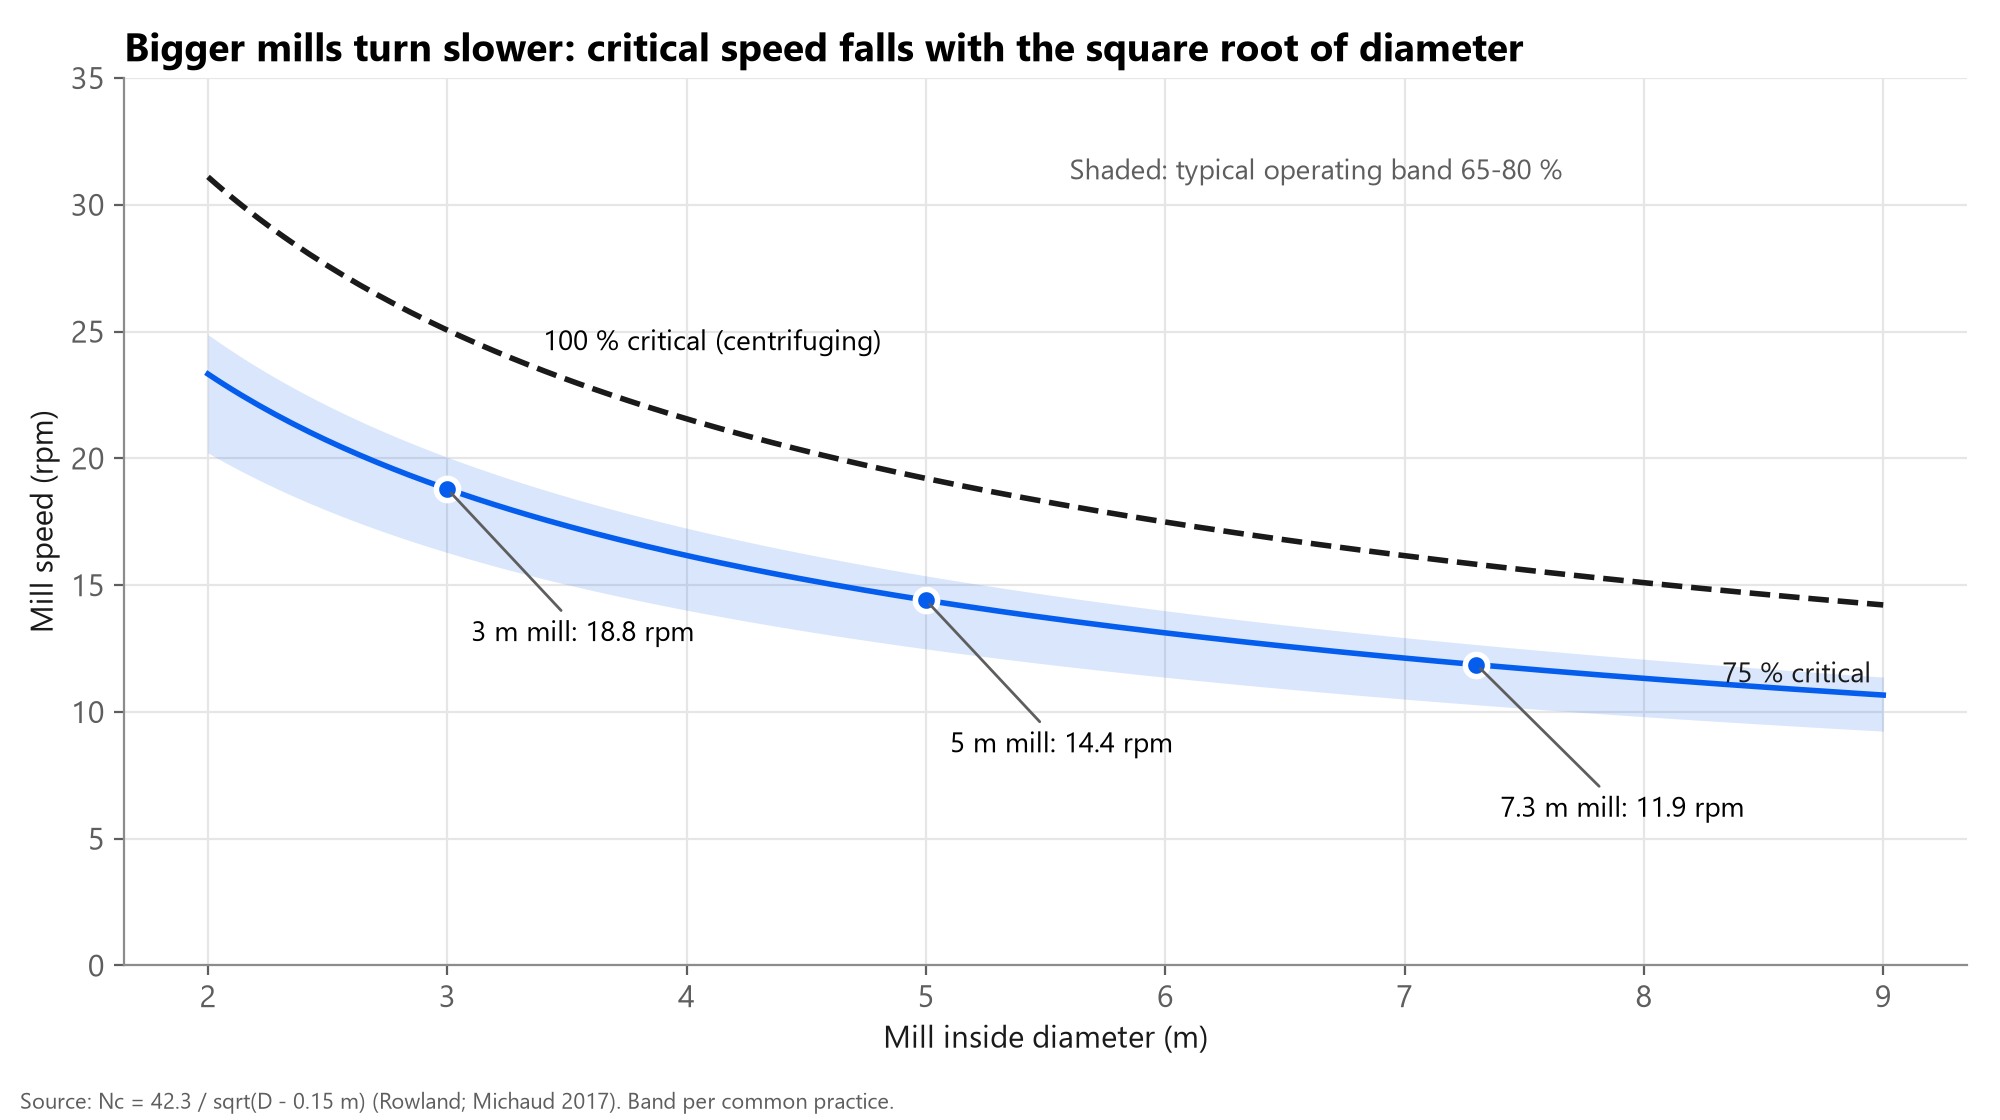
At critical speed the centrifugal force on a ball at the shell equals gravity, so the charge sticks to the liners and stops grinding. Nc = 42.3 / sqrt(D) rpm with D in metres (76.6 / sqrt(D) with D in feet). Michaud recommends using a diameter about 150 mm less than the inside shell diameter, to allow for liner thickness and the centre of mass of the outer ball layer.
Because Nc falls with the square root of diameter, big mills turn slowly: at 75 % of critical a 3 m mill runs at about 19 rpm, a 5 m mill at about 14 rpm and a 7.3 m mill at about 12 rpm. The shell's tip speed, however, increases with size.
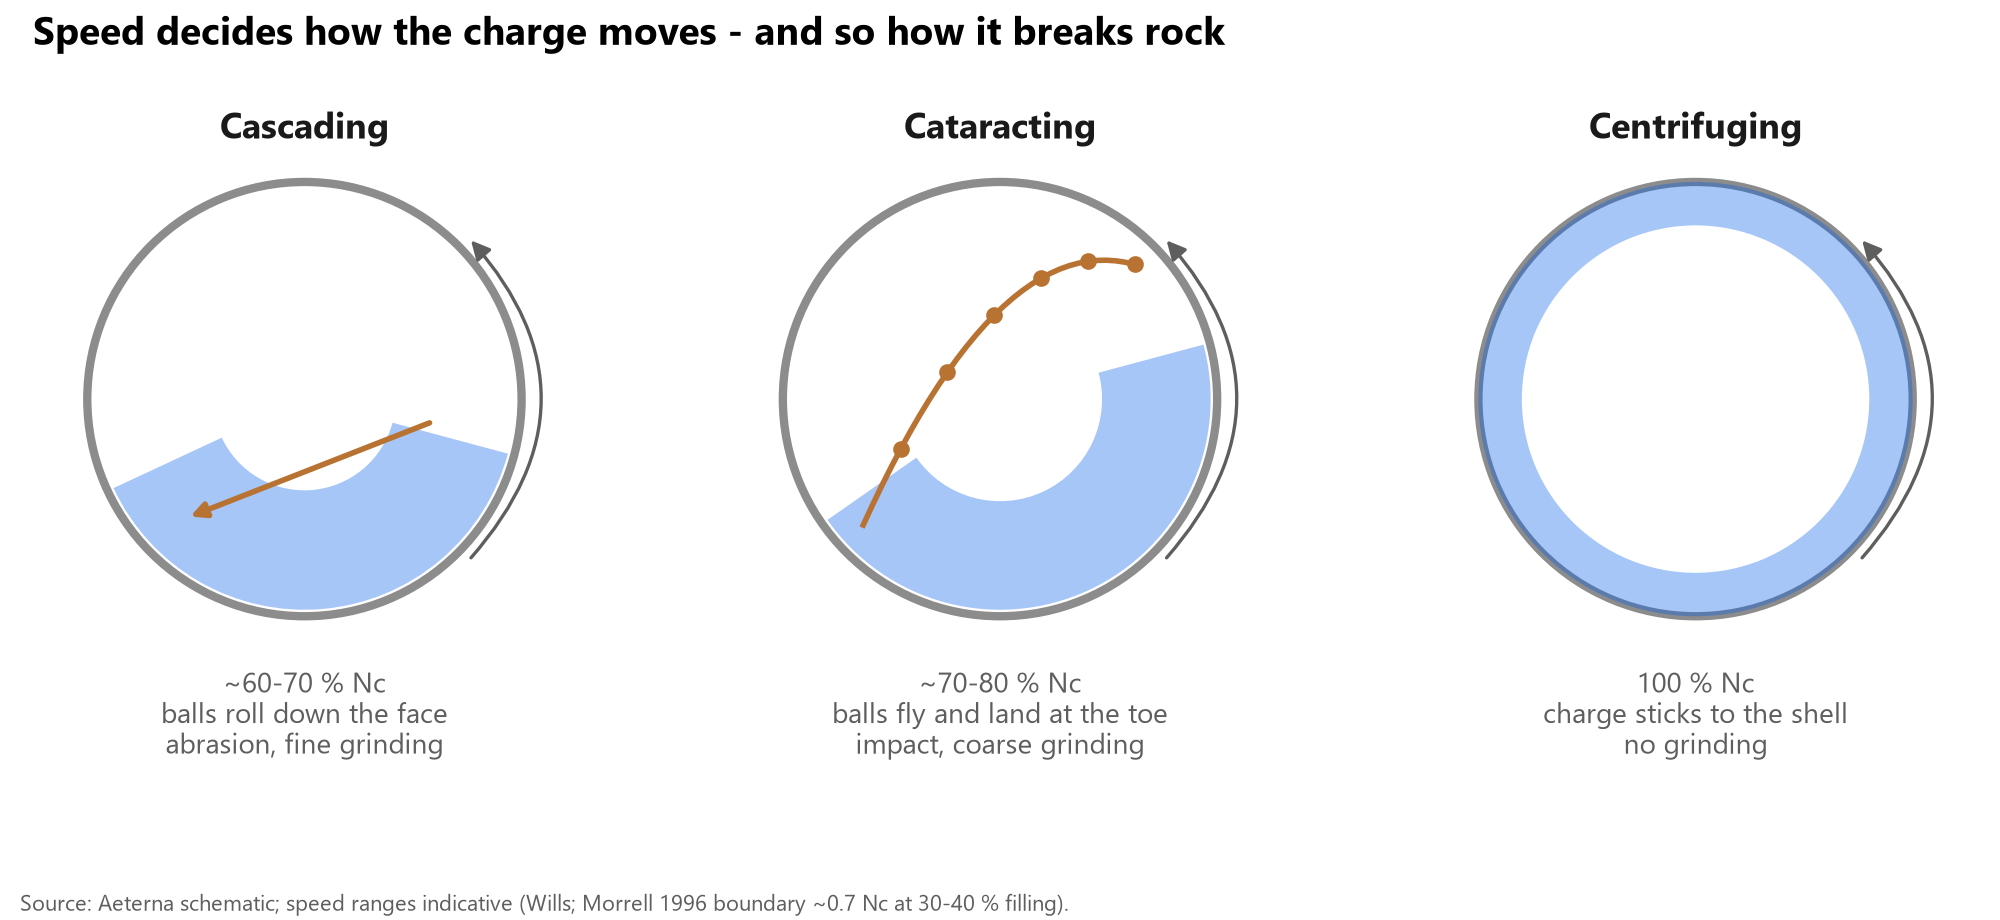
Below roughly 70 % of critical (at 30-40 % filling, after Morrell) the charge mostly cascades: balls roll down the charge face and grind by abrasion and attrition, suiting fine grinding. Above it, balls cataract: they are thrown from the shoulder and land near the toe, giving impact breakage suited to coarse feed. Too much speed, or lifters that are too aggressive, throws balls onto bare liners, which wastes energy and damages liners and balls.
Practical guidance: 75-78 % of critical for coarse grinding, depending on lifter face angle; slightly lower for fine grinding, where efficiency is less sensitive to speed. Most conventional ball mills sit between 65 and 80 %; cement mills cluster at 72-76 %.
Charge motion, filling and power
Mill power, and so throughput, depends on speed and filling together: power peaks at a combination of the two, and overfilling lowers power because the charge's centre of mass moves toward the mill axis. Charge filling in overflow ball mills is commonly in the 30-40 % range; grate discharge mills draw roughly 15-20 % more power than overflow mills at the same filling because there is no slurry pool.
Choosing the ball size
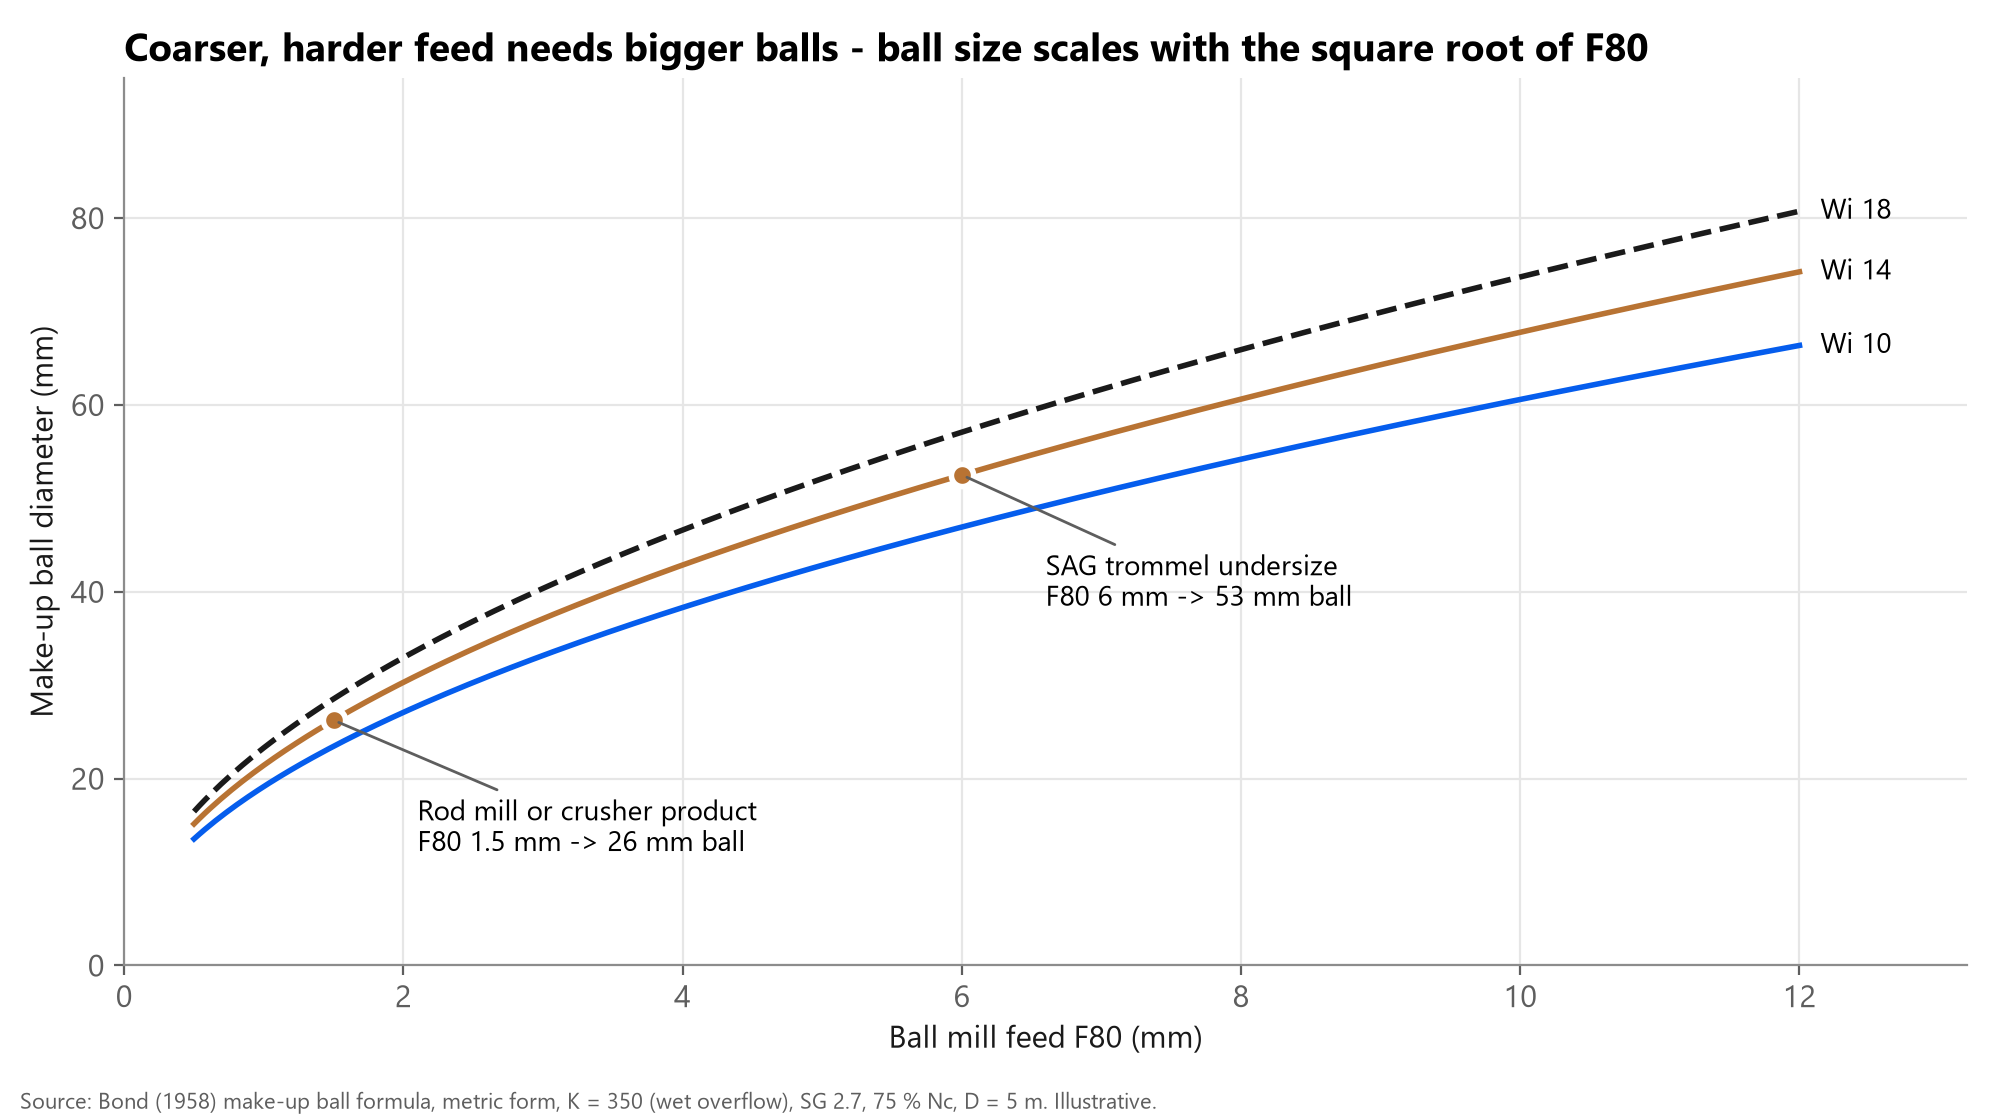
The largest (make-up) ball must be big enough to break the coarsest particles in the feed; any larger and the charge has fewer balls and less grinding surface for the fine particles. Bond's 1958 formula balances the two: B = (F80 / K)^0.5 x (SG x Wi / (Cs x sqrt(D)))^(1/3), with B in inches, F80 in µm, D in feet, Cs in % of critical speed and K = 350 for wet overflow mills (330 for wet grate mills and 335 for dry mills in other sources).
Ball size scales with the square root of feed size but only the cube root of hardness, and inversely with the sixth root of diameter, so feed size dominates. For a 14 kWh/t ore in a 5 m mill at 75 % of critical, a 1.5 mm feed calls for ~26 mm balls and a 6 mm SAG trommel undersize for ~53 mm balls.
Alternative correlations exist. Azzaroni's formula and the Allis-Chalmers formula can give very different answers: practitioners report Azzaroni giving up to about twice the Bond size in some cases. Use the formulas as a starting point, then confirm with plant trials, mill power and product size.
Over time the charge reaches a 'seasoned' size distribution from top size down to rejected scats. Keeping the make-up rate matched to wear (often tracked as grams of steel per kWh or per tonne) holds that distribution, and with it the power draw, steady.
Key numbers and rules of thumb
| Quantity | Typical value | Source |
|---|---|---|
| Bond equation | W = 10 Wi (1/sqrt(P80) - 1/sqrt(F80)) | Bond 1952 |
| Ball mill Wi, common metal ores | ~10-16 kWh/t (individual samples 8-20+) | Bond 1961 compilation |
| Grind 150 -> 75 µm | ~+57 % energy (Wi 14, F80 2 mm) | Calculated, Bond + EF5 |
| Fine-grind factor EF5 | (P80 + 10.3) / (1.145 P80) below 75 µm | Rowland |
| Diameter factor EF3 | 0.914 for D >= 3.81 m | Rowland |
| Dry grinding factor | 1.3 | Rowland; Bond test procedure |
| Critical speed | Nc = 42.3 / sqrt(D - 0.15) rpm, D in m | Michaud 2017 |
| Operating speed | 65-80 % Nc; 75-78 % for coarse grinding | Michaud 2017; common practice |
| Cascade / cataract boundary | ~70 % Nc at 30-40 % filling | Morrell 1996 |
| Ball charge filling (overflow) | ~30-40 % of mill volume | Practitioner range |
| Grate vs overflow power | Grate draws ~15-20 % more at same filling | UCT thesis; practitioner |
| Make-up ball, 6 mm feed, Wi 14, 5 m mill | ~50-55 mm | Bond 1958, calculated |
| Comminution share of mine-site energy | ~25-27 % average | Weir / CEEC review 2021 |
Where instrumentation and control fit
These fundamentals are design-stage numbers, but each has an operating shadow. The work index changes as ore domains change, so the same mill draws different kWh/t from week to week; tracking an operating work index from power and particle size gives operators an early, objective read on efficiency. Charge level and ball size distribution drift as balls wear, which moves power draw and grind.
Aeterna's Ball Counter tracks steel ball additions so the charge in the process model stays accurate, and online particle-size and power data can feed an operating work index trend. Model predictive control can then help hold grind size and mill load steady through ore changes. For mill-power behaviour see the existing post on mill shell signatures; for circulating load see the recycle-load post.
Common misconceptions
- 'Work index is a constant for the deposit.' It varies by domain and sample; design on a distribution, operate on a trend.
- 'Faster is always more throughput.' Power rises with speed only up to a point, and above ~80 % Nc balls can strike bare liners, wasting energy and steel.
- 'Bigger balls grind harder ore better.' Oversized balls reduce surface area and fines breakage; size balls to the coarsest feed, not the hardest headline.
- 'Bond is obsolete.' Newer models (Morrell's Mi, population balance, DEM) refine it, especially for fine grinding and HPGR, but Bond remains the industry's common language and benchmark.
- 'Only about 1 % of mill energy breaks rock.' That figure compares mill energy with theoretical surface energy. Against single-particle breakage as a reference, Fuerstenau and Abouzeid estimated ball milling at roughly 15 % efficient for quartz - room to improve, but not hopeless.
Where sources disagree or are uncertain
- K in Bond's ball formula: 350 for wet grinding in most metric sources, but some design worksheets use 330 for wet overflow mills. The difference is about 3 % in ball size.
- Work index tables: the unit basis (short ton vs metric tonne) is often not stated; the difference is about 10 %.
- Operating speed: 65-80 % is a broad consensus band; specific recommendations range from 72-76 % (cement) to 75-78 % (coarse mineral grinding), and up to 90 % in rare cases.
- Comminution share of mine energy: estimates range from ~25 % (average) to 50-90 % at individual sites; data quality is weak (Napier-Munn 2015).
- Morrell's ~0.7 Nc cascade/cataract boundary was taken from a secondary source; check against the 1996 paper before quoting in the blog.
Ask us how an operating work index trend could look on your grinding circuit.
Talk to an engineerSources
- The third theory of comminution, F.C. Bond, Trans. AIME 193, 484-494, 1952
- Crushing and grinding calculations, F.C. Bond, British Chemical Engineering 6, 1961
- Grinding ball size selection, F.C. Bond, Mining Engineering / AIME (OneMine), 1958
- Comminution circuit specific energy (Bond) - efficiency factors EF1-EF8, Met Dynamics wiki (after Rowland), n.d.
- Using the Bond work index to measure operating comminution efficiency, C.A. Rowland, SME (OneMine), 1999
- Recommended ball mill speed and liner configuration, D. Michaud, 911Metallurgist, 2017
- Bond grindability test procedure, 911Metallurgist, n.d.
- Table of Bond work index by minerals, 911Metallurgist (after Bond 1961), n.d.
- Power draw of wet tumbling mills and its relationship to charge dynamics, S. Morrell, Trans. IMM C105, 1996
- An alternative energy-size relationship to that proposed by Bond, S. Morrell, Int. J. Miner. Process. 74, 133-141, 2004
- The energy efficiency of ball milling in comminution, D.W. Fuerstenau & A.-Z.M. Abouzeid, Int. J. Miner. Process. 67, 2002
- Is progress in energy-efficient comminution doomed?, T.J. Napier-Munn, Minerals Engineering 73, 2015
- New report highlights role of comminution in emissions reduction, CIM Magazine (Weir / CEEC review), 2021
- Developing a ball mill model that incorporates grate and overflow discharge configurations, University of Cape Town (thesis), n.d.
- Wills' Mineral Processing Technology, 8th ed., B.A. Wills & J. Finch, Elsevier, 2016